An In-Depth Analysis of Industrial Output, FDI Inflows, and Export Performance
| Executive Summary |
| The launch of the ‘Make in India’ scheme by Prime Minister Narendra Modi in September 2014 marked a significant shift in India’s industrial policy, to establish India as a global manufacturing hub, and an increase in the share of the manufacturing industry in GDP to 25% by 2022 (or eventually 2025) from 16%. Besides, it also promised the provision of 100 million extra job opportunities. Over a decade later, with 2025 approaching, ‘Make in India’ offers a rich mix of outputs and inputs, which can be studied in a data-driven and systematic way. This study provides an examination of the transition in the manufacturing sector via three focal points: (1) the growth of the industrial output, (2) the foreign direct investment (FDI) inflows, and (3) export performance. The analysis provides a mixed picture; the manufacturing sector has seen exceptional growth of FDI at 69%, reached notable export benchmarks in selected sectors such as electronics and pharmaceutical products, and has attracted investments over ₹1.76 lakh crore in the Production-Linked Incentives (PLI) scheme, all while not meeting its headline target starring a contribution to GDP of 25% to approximately 13-17%. |
1. The Manufacturing GDP Paradox: Ambition vs. Reality
The central promise of ‘Make in India’ was to elevate manufacturing’s share in India’s GDP to 25% by 2025. This target was not arbitrary—it was benchmarked against manufacturing powerhouses like China (approximately 29% during 2011-2022), Germany and Japan (around 20%), reflecting a recognition that India’s economy had effectively leapfrogged the manufacturing stage, jumping from agriculture-dominated (59% of GDP in 1950) to services-dominated (59% by 2011).

The data present a stark reality. The share of manufacturing in GDP was about 17% in 2014 when ‘Make in India’ was started. In 2023, it was slightly below this, measuring around 13-17% depending on the method of measurement, and as of 2024, it is approximately 12.53-13% for the latest measurement. That is not the increase of 9 percentage points foresight, but stagnation or decline—a far distance from the desired transformational change.
The central promise of 'Make in India' was to elevate manufacturing's share in India's GDP to 25% by 2025.
| Why the GDP Target Proved Elusive Several structural factors explain this outcome: (1) India’s services sector grew even faster, expanding from 53% of GDP in 2014 to over 54.93% by 2025, effectively diluting manufacturing’s relative share; (2) The COVID-19 pandemic disrupted manufacturing output between 2020-2022; (3) Capital-intensive manufacturing investments don’t immediately translate to GDP share increases; and (4) Global economic headwinds, including supply chain disruptions and geopolitical tensions, impacted manufacturing momentum. |
In absolute terms, however, the situation looks more encouraging. The manufacturing sector, in terms of output in value, grew from $377.7 billion in 2020 to an estimated $440 billion by 2022, with forecasts suggesting this sector could expand further to ₹87.57 lakh crore (or $1 trillion) by FY 2025-26. This illustrates that while the manufacturing sector has expanded in absolute terms and continues to grow, at the same time, it is not growing fast enough to outpace overall economic growth and, therefore, has not increased its GDP contribution significantly.
- FDI Inflows: The Success Story of Global Confidence
If there’s one unambiguous success metric for ‘Make in India,’ it’s the dramatic surge in foreign direct investment. The manufacturing sector has become increasingly attractive to global investors seeking to diversify supply chains beyond China—the so-called “China+1” strategy that gained momentum after COVID-19 and amid geopolitical tensions.

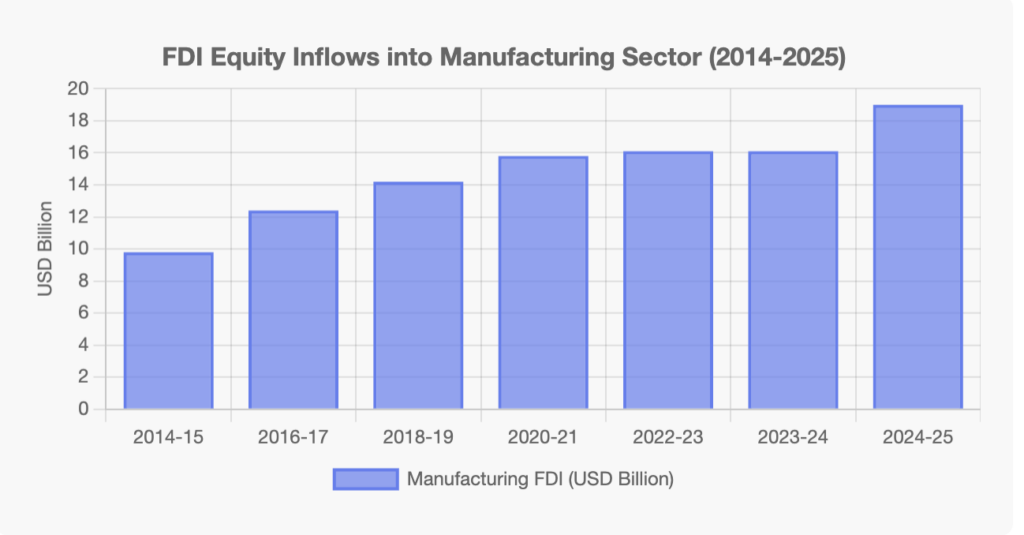
FDI equity inflows into manufacturing climbed by 69%, from $97.7 billion during 2004-2014 to $165.1 billion during 2014-2024. Between April 2014 and March 2025, the manufacturing industry alone attracted an astonishing $184.15 billion in FDI equity inflows. The momentum was sustained strongly into FY 2024-25, with manufacturing FDI up 18% year-on-year to $19.04 billion from $16.12 billion in FY 2023-24.
FDI equity inflows into manufacturing climbed by 69%, from $97.7 billion during 2004-2014 to $165.1 billion during 2014-2024.
The quickening of investment was the result of systematic policy adjustments or macroeconomic reforms such as the liberalization of FDI caps across sectors; 100% FDI was permitted in contract manufacturing and coal mining; and streamlined approval processes led to India’s Ease of Doing Business ranking improving from 142nd in 2015 to 63rd in 2020, as well as industry-specific financial incentives under the PLI scheme. Although the top source countries for FDI were Singapore, Mauritius, and the United States, investors from Singapore provided over $11 billion in FDI in FY 2024 alone.
Examining the sectoral composition of FDI also demonstrates shifts in strategy. Services and computer software/hardware were the dominant sectors, with steady increases occurring within the manufacturing sectors. Sectors that grew at a pace comparable to or greater than FDI investment were electronics, automotive, chemicals, and consumer goods. The PLI scheme appears to have provided substantial impetus for the electronics manufacturing sector, which experienced a 254% total increase in FDI.
3. The PLI Revolution: Performance-Based Manufacturing Incentives
Launched in April 2020 with an outlay of ₹1.97 lakh crore across 14 strategic sectors, the Production-Linked Incentive (PLI) scheme represents perhaps the most sophisticated and successful policy instrument in India’s manufacturing arsenal. Unlike traditional subsidy approaches, PLI offers incentives based on actual incremental production and sales, creating a results-oriented framework.
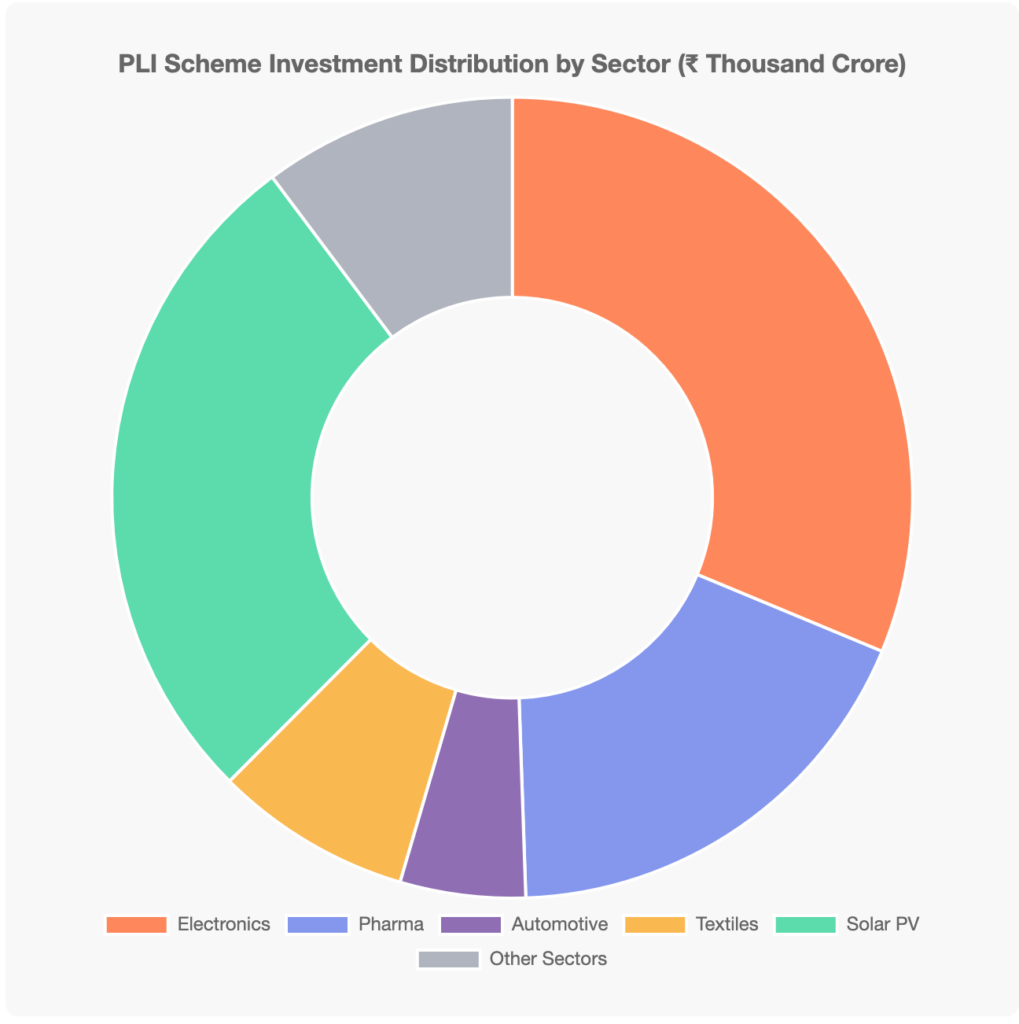
By March 2025, the scheme’s achievements were substantial: 806 applications approved across 14 sectors, ₹1.76 lakh crore in realised investments, ₹16.5 lakh crore in cumulative production/sales, over 12 lakh direct and indirect jobs created, and ₹21,534 crore in incentive payouts by June 2025. The scheme’s return on investment has been impressive—generating 19 times the revenue compared to disbursements in key sectors like smartphone manufacturing.
The share of manufacturing in GDP was about 17% in 2014 when 'Make in India' was started... and as of 2024, it is approximately 12.53-13% for the latest measurement.
Sectoral Performance Under PLI
Electronics Manufacturing: The highlight of PLI’s success. Production growth increased by 146%, from ₹2.13 lakh crore in FY 2020-21 to ₹5.25 lakh crore in FY 2024-25. Mobile phone exports increased by 775%, from ₹22,870 crore to ₹2 lakh crore. India became the largest smartphone exporter in the world, with mobile phone exports reaching $34.01 billion at the end of 2023. Value addition in smartphone manufacturing increased from 12% to approximately 20%, with expectations of 70-90% by FY27. Corporations, such as Apple’s contract managers (Foxconn, Pegatron, Wistron) and Samsung, made this change.
Pharmaceuticals: Sales under PLI reached over ₹2.66 lakh crore, with exports reaching ₹1.70 lakh crore, contributing to this number. Domestic value addition increased to 83.7% by March 2025, representing India’s success in becoming “the pharmacy of the world” with a decreased dependence on imports for Active Pharmaceutical Ingredients (APIs).
Solar PV Modules: Investments of ₹48,120 crore committed to build a capacity of 48 GW of fully integrated domestic capacity. The industry created roughly 38,500 direct jobs by June 2025, while allowing India to lessen its dependency on solar module imports and enhance energy security.
Automotive Sector: Investment exceeded ₹8,910 crore, where ₹1,084 crore was disbursed as an incentive under PLI. It was expected that the PLI for electric vehicles and hydrogen fuel vehicles would create an estimated 750,000 direct jobs throughout their lifecycle, supporting India’s shift towards cleaner mobility.
Electronics manufacturing... production growth increased by 146%, from ₹2.13 lakh crore in FY 2020-21 to ₹5.25 lakh crore in FY 2024-25.
4. Export Performance: Breaking New Ground
Merchandise exports had a significant growth during the decade of ‘Make in India’, yet it was not constant. The per-dollar value of merchandise exports in the fiscal year 2014 was $310 billion, which by the fiscal year 2024 reached $437.42 billion, along with a compound annual growth rate of about 3.5% in that period. The total estimated exports of merchandise and services combined were $820.93 billion in the fiscal year 2024-25, or a rise of 5.5% from the previous year’s $778.13 billion.
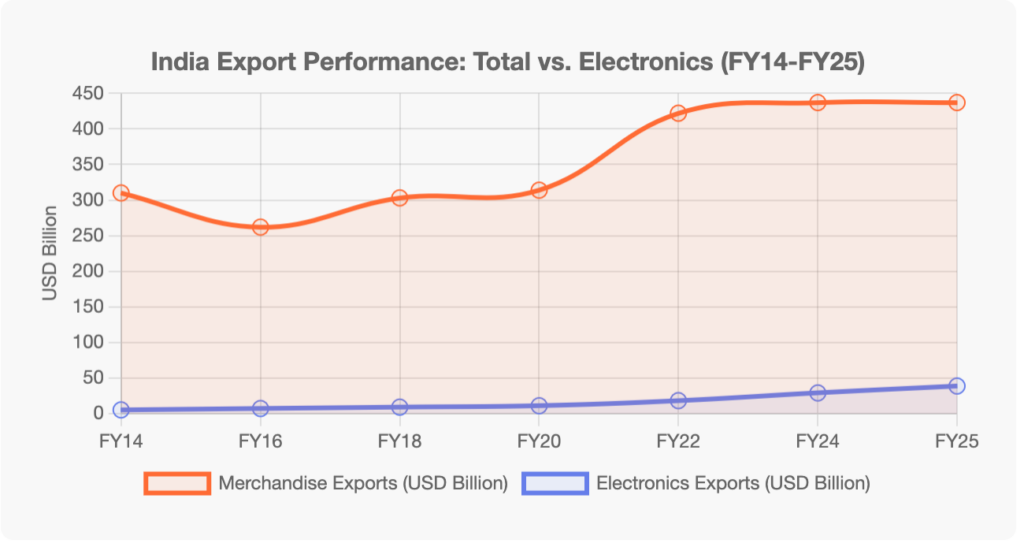
In FY25, not surprisingly, the leading exports were engineering goods ($116.54 billion, 27% of India’s total exports) and the combined value of petroleum products, gems and jewellery, chemicals, electronics and pharmaceuticals amounted to ₹23.87 lakh crore ($279.69 billion). Electronics exports have surged from $29.1 billion (FY24) to $38.6 billion (FY25) and are expected to be $46-50 billion through FY26. The Indian Cellular and Electronics Association’s (ICEA) growth has attributed this idea to the PLI schemes supported by players.
In April-June of FY26 (1QFY26), indicators of excellent export demand were apparent with exports rising to $210.31 billion, up 6% from the previous year. Pharmaceuticals, electronics, engineering goods, chemicals, and e-commerce were behind the export growth for the quarter. Even with the ongoing volatility of global demand and geopolitical tensions, the top six product groupings were still robust.
5. Industrial Output and Manufacturing PMI: Measuring Momentum
The Index of Industrial Production (IIP), which measures the activity of the mining, manufacturing, and electricity sectors, offers a monthly view of the performance of the manufacturing sector. Since manufacturing accounts for nearly 77.63% of total industrial production, it is the strongest contributor to that indicator. In FY 2024-25, the growth of output in the manufacturing sector was 4.26%%, a notable increase from the only 1.4% growth of output in FY 2023-24, therefore indicating growth momentum, which should be welcomed.
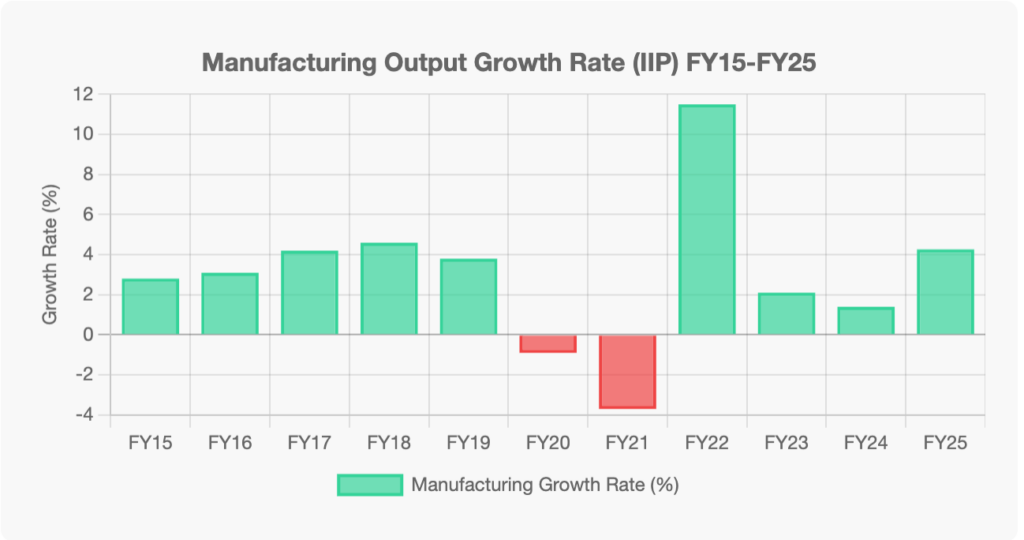
The monthly figures for 2025 reflected a fairly steady growth. For instance, the levels of growth in September 2025 were 4% IIP growth and 4.8% growth in the manufacturing component, while in August, we again saw a 4 % growth in total IIP and 3.8% growth in manufacturing. July 2025 also had 4 % IIP growth. The HSBC India Manufacturing Purchasing Managers’ Index (PMI) rose to a 16-month high of 59.1 in July 2025, suggesting the fastest increase in factory orders in almost five years. PMIs above 50 reflect expansion, and a sustained period above 58 suggests a healthy industrial landscape. With respect to manufacturing, only 13 – 14 of the 23 industry groups at the NIC 2-digit level showed positive growth in recent months. The top contributors to positive growth included: manufacture of basic metals (12.3%), manufacture of electrical equipment (28.7%), and manufacture of motor vehicles, trailers and semi-trailers (14.6%). Even so, the mixture of positive industries would suggest growth that is broad-based rather than narrowly concentrated.
Merchandise exports had a significant growth during the decade of 'Make in India', rising from $310 billion in FY 2014 to $437.42 billion in FY 2024.
6. Employment Creation: The Unfulfilled Promise
The ‘Make in India’ initiative had an aspirational target of creating 100 million new jobs in the manufacturing sector by 2022, which remains clearly unmet. According to the 6th Economic Census, the manufacturing sector employed 30.3 million people in 2013-14. While the number increased to 51.3 million in 2017, it fell to 35.7 million in 2023, partly due to COVID-19, but even before that, the trend was downwards.
On the positive side, there have been several welcome developments: manufacturing job creation growth has accelerated from 6 percent in the period between 2004 and 2014 to 15 percent in the past decade; the PLI scheme has resulted in more than 12 lakh or 1.2 million jobs, both direct and indirect, across sectors; certain sectors-e.g., electronics-have created almost 300,000 direct and 600,000 indirect jobs, with significant women participation in blue-collar jobs. But these positive developments fall woefully short of 100 million. They raise the question of whether manufacturing sector employment growth in an age of automation and capital-intensive production is possible at levels earlier imagined.
Yet high-profile announcements over investment do not translate into significant job creation. In the case of Coca-Cola announcing an investment of ₹3,000 crore in Gujarat, for example, just 1,400 jobs were created; Nestlé announced an investment of ₹900 crore in Odisha and created just over 800 jobs. This speaks to the capital-intensive nature of modern manufacturing and the problems of achieving job-intensive growth.
7. Structural Reforms and Policy Evolution
In addition to headline initiatives, structural reforms took place during the ‘Make in India’ decade. The introduction of the Goods and Services Tax (GST) in 2017 successfully established a unified national market that reduced the costs of logistics for businesses and freed them from compliance burdens. Logistics costs in India, which were approximately 14% of GDP before reform, were projected to fall to 7.97% by 2025, which, while a much-improved outcome, remains relatively higher than a range of 8-10% of GDP in developed economies.
The National Logistics Policy, created under the National Industrial Corridor Development Programme (wherein 12 new projects were cleared, aiming at an investment of ₹28,602 crore), as well as focused interventions like the Prime Minister’s Manufacturing Infrastructure Technology & Research Award (PM-MITRA) parks for textiles, have been initiated as enabling infrastructure. The Development of Enterprises and Strategic Hubs (DESH) Bill is planned to take approvals further along. Wider industrial corridors like the Delhi-Mumbai Industrial Corridor (DMIC) and Chennai-Bengaluru Industrial Corridor (CBIC) similarly formed cluster-based manufacturing ecosystems.
The National Manufacturing Mission announced in the Union Budget 2025-26 represents the next step in reforming the policy approach that began with ‘Make in India’. The focus of the mission is on five priority areas: ease of and cost of doing business, developing the future-ready workforce, vibrant MSME sector, access to technology, quality products, and with a specific mention to clean-tech manufacturing (solar PV cells, EV batteries, electrolysers, wind turbines, grid-scale batteries).
The 'Make in India' initiative had an aspirational target of creating 100 million new jobs in the manufacturing sector by 2022, which remains clearly unmet.
8. Challenges and Structural Constraints
Although achievements have been made, serious challenges remain. There are still unresolved issues related to infrastructure deficiency, with the World Bank estimating that India needs an investment of $840 billion over 15 years. There is also an acute skill gap (4.7% of India’s workforce has any formal skill training compared to 96% in South Korea). The MSME sector faces challenges obtaining bank credit; an estimate from the RBI Expert Committee indicates the summary credit gap is in the range of ₹20-25 trillion. In March 2025, total MSME credit exposure was estimated at ₹35.2 lakh crore (a growth of 13% YoY), with sizeable reported gaps.
The existence of global competitors consisting of low-cost producers like China and Vietnam in the Indian manufacturing space exerts considerable pressure on growth. India also lacks the experience of East Asian manufacturers in terms of innovation, while still facing numerous burdens caused by regulations (even with simplifications), and while there is uptake of PLI, advancements are uneven across sectors (electronics are going well, while textiles, solar modules and white goods lag). In addition, land acquisition issues, delays in environmental clearance, and dealing with and complying with different state policies also contributed to other friction to growth in manufacturing.
9. Global Context: India’s Manufacturing Position
Benchmarked against top global economies, India’s manufacturing sector shows both potential and gaps. Among the world’s five largest economies, only the US has a lower manufacturing GDP contribution (~11%) than India. China’s manufacturing averages ~29% of GDP (2011-2022), while Japan and Germany maintain ~20%. This comparison suggests significant headroom for India’s manufacturing expansion.
However, India has emerged as a credible “China+1” alternative. The country now ranks as the second-largest mobile phone manufacturer globally. Its pharmaceutical exports serve global markets as the “pharmacy of the world.” The wind energy sector could cater to 10% of global demand by 2030. India’s potential to add $500 billion annually to the global economy by 2030 (if fully realising its manufacturing potential) positions it as a critical node in reconfiguring global supply chains post-pandemic.
The manufacturing sector is improving qualitatively, if not actually meeting quantitative headline targets.
Conclusion: A Mixed Scorecard with Momentum Building
The ‘Make in India’ decade is a mixed bag. The headline target of increasing the share of manufacturing in GDP to 25% was never reached-it actually hovered at 13-17%. The promise of 100 million jobs remains far off. But behind these misses, there are some substantial successes: 69% growth in FDI, $184 billion manufacturing FDI from 2014 to 2025, sustained manufacturing PMI above 58-59, indicating robust expansion, PLI scheme delivering 19x returns in key sectors with ₹16.5 lakh crore in production, and exports rising from $310 billion to $437 billion despite global headwinds.
The manufacturing sector is improving qualitatively, if not actually meeting quantitative headline targets. In electronics, local value addition surged from 30% to 70-90%, easing dependence on imports. There was a dramatic spurt in pharmaceutical self-sufficiency. Similarly, solar manufacturing capacity has risen to break foreign dependence. These structural changes may take time to percolate into GDP percentages, but they lay the base for sustained growth.
Looking ahead to 2025-2030, the emphasis in the National Manufacturing Mission on clean-tech, workforce development, and strengthening MSMEs does indicate policy learning during the course of a decade under ‘Make in India’. But the hard challenge of converting investment and production growth into GDP share expansion and employment generation at scale-essentially, continued focus on skill development, infrastructure, ease of doing business, and innovation ecosystems-remains. Indeed, that is what India’s manufacturing journey since 2014 teaches: transforming a service-dominated economy into a manufacturing powerhouse is neither quick nor linear, and steady progress amidst global uncertainties is its own form of success.
References:
- India Briefing. (2025). “India Manufacturing Tracker: 2024-25.” https://www.india-briefing.com/news/india-manufacturing-tracker-2025-33968.html/
- Indian Brand Equity Foundation (IBEF). (2025). “Indian Manufacturing Industry Analysis.” https://www.ibef.org/industry/manufactur-presentation
- Indian Brand Equity Foundation (IBEF). (2025). “Manufacturing Industries in India & its Growth.” https://www.ibef.org/industry/manufacturing-sector-india
- Indian Brand Equity Foundation (IBEF). (2025). “Foreign Direct Investment in India | FDI Trends & Insights.” https://www.ibef.org/economy/foreign-direct-investment
- Drishti IAS. (2025). “The Rise of the Indian Manufacturing Sector.” https://www.drishtiias.com/daily-updates/daily-news-editorials/the-rise-of-indian-manufacturing-sector
- DD News. (2025). “India Writes a New Chapter in Manufacturing: PLI Scheme Accelerates Growth.” https://ddnews.gov.in/en/india-writes-a-new-chapter-in-manufacturing-pli-scheme-accelerates-growth/
- StudyIQ. (2024). “Production Linked Incentive (PLI) Scheme in India and its Key Sectors.” https://www.studyiq.com/articles/production-linked-incentive-pli-scheme/
- Down to Earth. (2024). “10 Years of ‘Make in India’: Did It Achieve Its Goals?” https://www.downtoearth.org.in/governance/but-did-we-really-make-in-india
- Press Information Bureau, Government of India. (2025). “Cumulative Exports Data FY 2024-25.” https://www.pib.gov.in/PressReleasePage.aspx?PRID=2122016
- Trading Economics. (2025). “India Industrial Production.” https://tradingeconomics.com/india/industrial-production
- Statista. (2024). “Manufacturing sector’s share of GDP in India from 2010 to 2023.” https://www.statista.com/statistics/1379872/india-manufacturing-as-a-share-of-gdp/
- World Bank Data. (2024). “Manufacturing, value added (% of GDP) – India.” https://data.worldbank.org/indicator/NV.IND.MANF.ZS?locations=IN
- RSM India. (2025). “Production Linked Incentive Schemes in India.” https://www.rsm.global/india/insights/tax-insights/pli-scheme-in-india
- India Briefing. (2023). “Overview of Production Linked Incentive Schemes in India.” https://www.india-briefing.com/news/what-are-production-linked-incentive-schemes-and-how-will-they-build-up-indias-manufacturing-capacity-23538.html/
- Visual Capitalist. (2023). “Charted: India’s FDI Inflows Over the Last 20+ Years.” https://www.visualcapitalist.com/indias-fdi-inflows/
Divyanka Tandon holds an M.Tech in Data Analytics from BITS Pilani. With a strong foundation in technology and data interpretation, her work focuses on geopolitical risk analysis and writing articles that make sense of global and national data, trends, and their underlying causes. Views expressed are the author’s own.