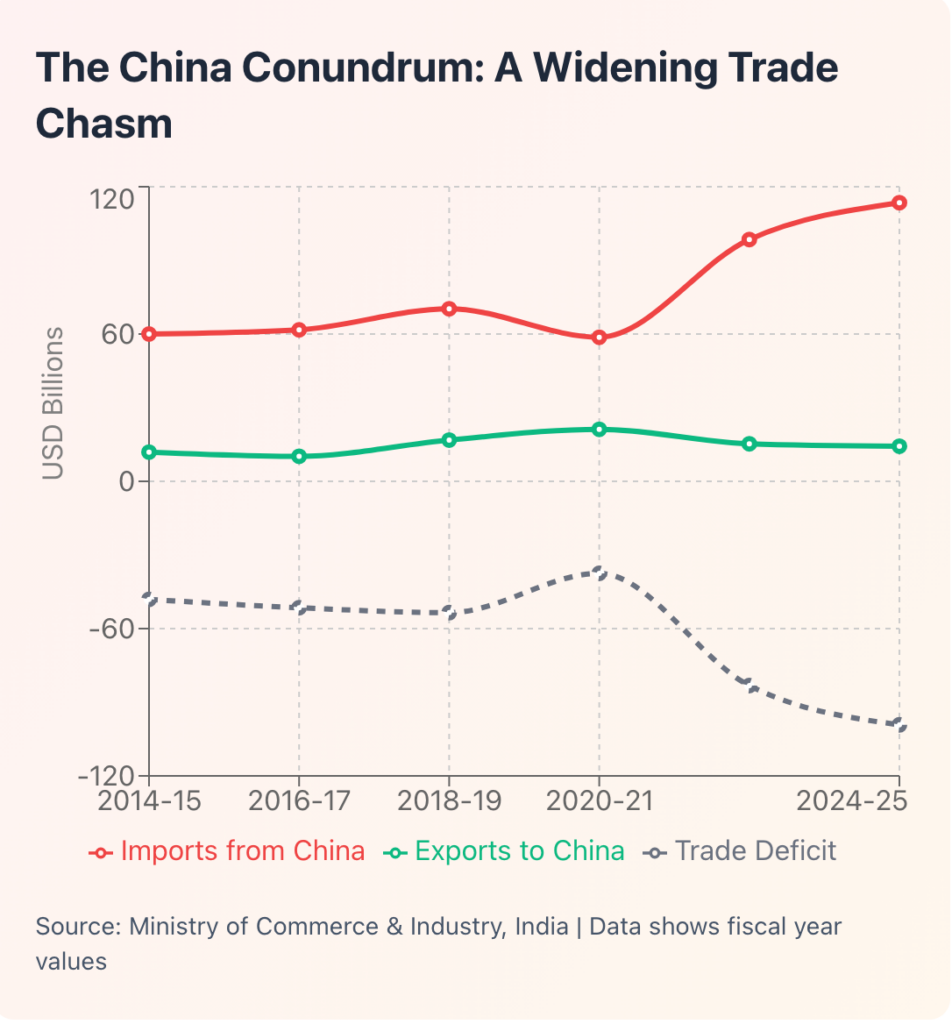
- The trade gap between India and China has widened from $48 billion in the year 2014-15 to an unprecedented $99.2 billion in the year 2024-25, which is a 106% increase.
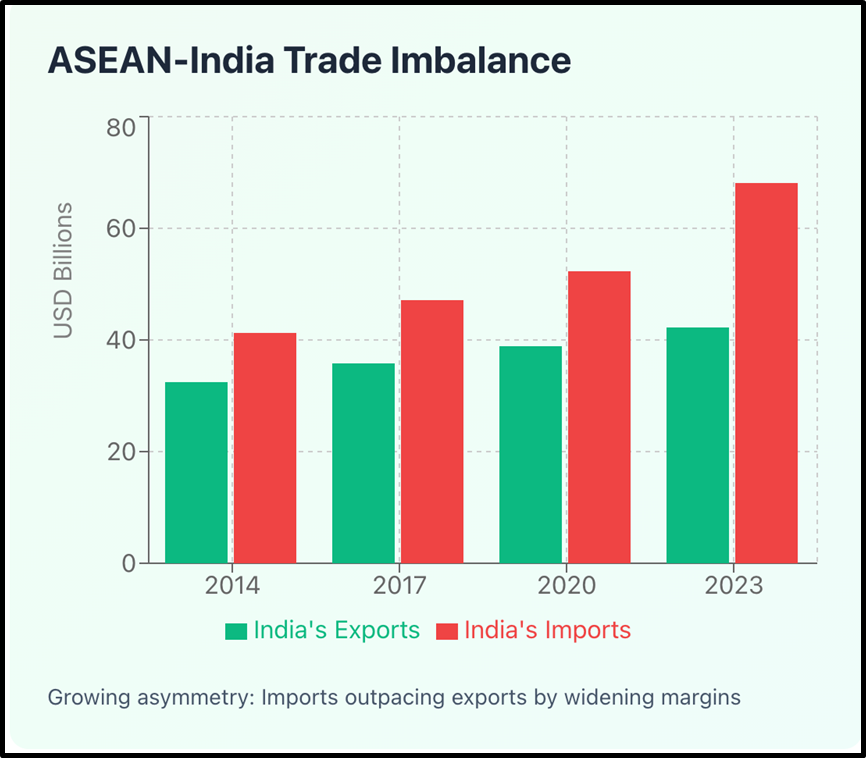
- Between FY 2009 and FY 2023, the increase in India’s imports from ASEAN was 234.4% while that of exports was only 130.4%.
- The data from 2014 to 2025 presents a paradox whereby, despite significantly expanding the GDP, with a near approaching $4 trillion, a trade that is 50% bigger, and multiplying policy initiatives, strategic dependencies have deepened in critical sectors.
- Strategic autonomy, in its genuine sense—the ability to pursue independent foreign policy choices without external economic leverage—remains aspirational rather than actual.
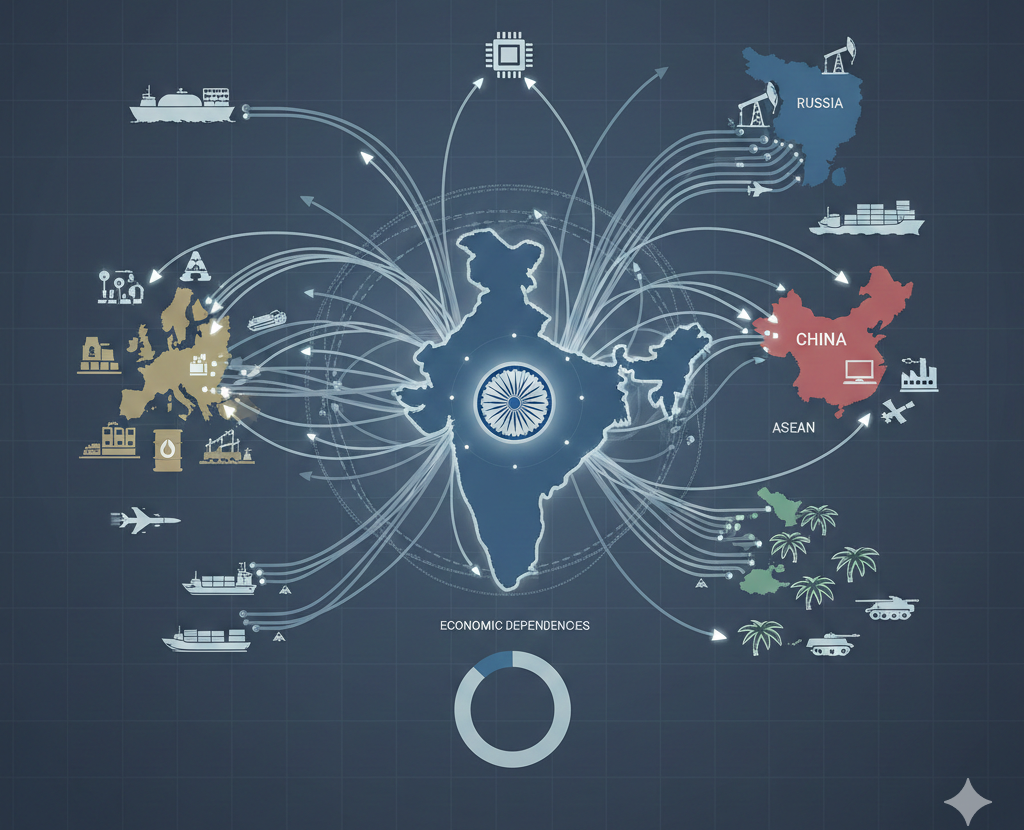
The Strategic Autonomy Paradox
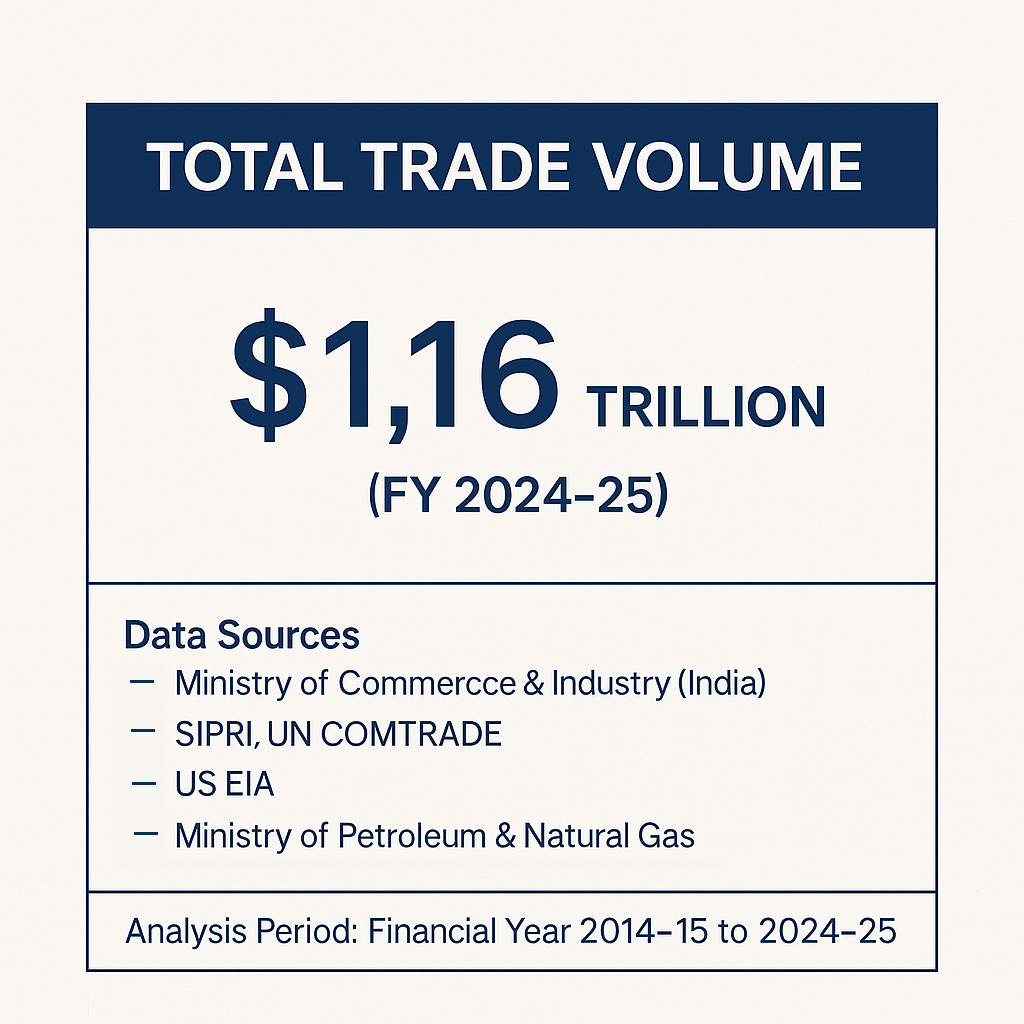
Over the past decade, India has pursued an ambitious vision of strategic autonomy—the ability to make independent foreign policy decisions without external pressure. But this wish still has a tangled web of economic interdependencies that limit India’s geopolitical range of manoeuvre. The value of India’s entire merchandise trade increased during the period 2014 to 2025 from $769 billion to about $1.16 trillion, but the change in trade composition indicated an increase in the interdependence with respect to areas critical for the nation’s security and economic sovereignty.
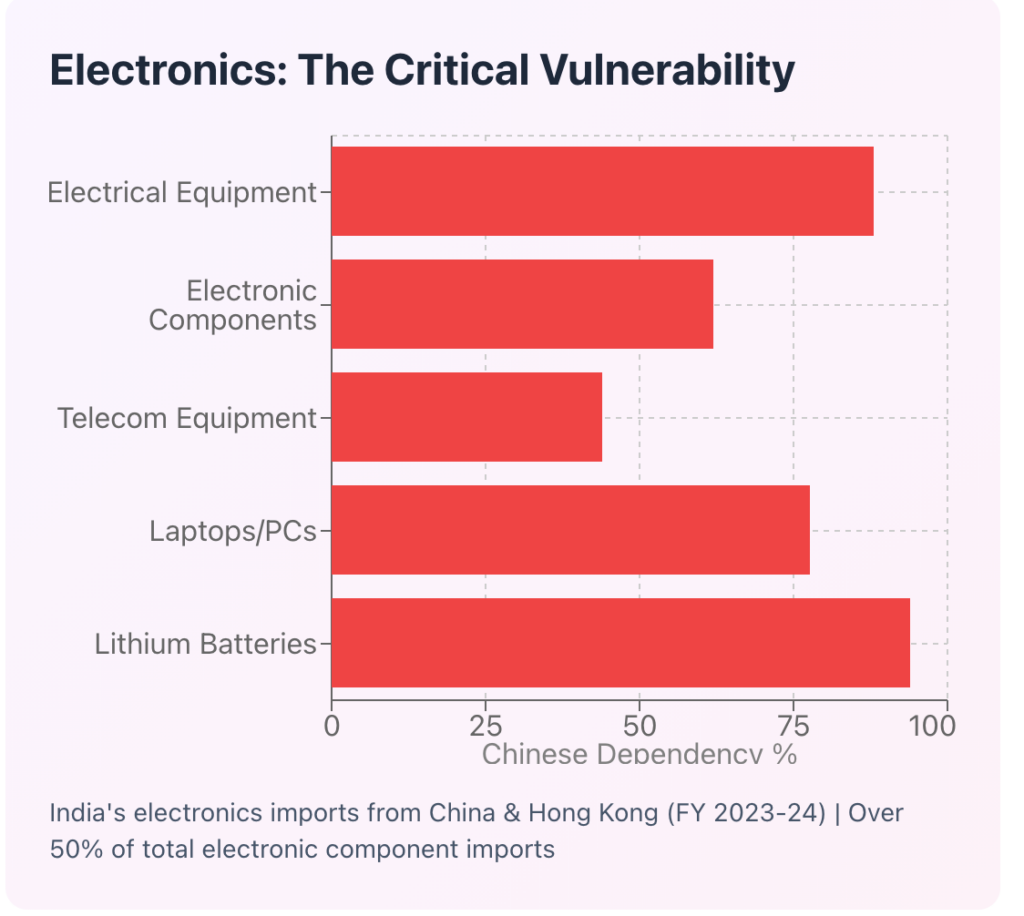
The statistics narrate a very compelling tale: the trade gap between India and China has widened from $48 billion in the year 2014-15 to an unprecedented $99.2 billion in the year 2024-25, which is a 106% increase. The deficit is greater than the combined GDP of a number of small countries. At the same time, India’s dependence on imported crude oil has reached a peak of 88.2%, and the country imports nearly two-thirds (62%) of its electronic components from China and Hong Kong, including the vast majority (94%) of lithium-ion batteries, which are vital for the electrification of the vehicle transition.
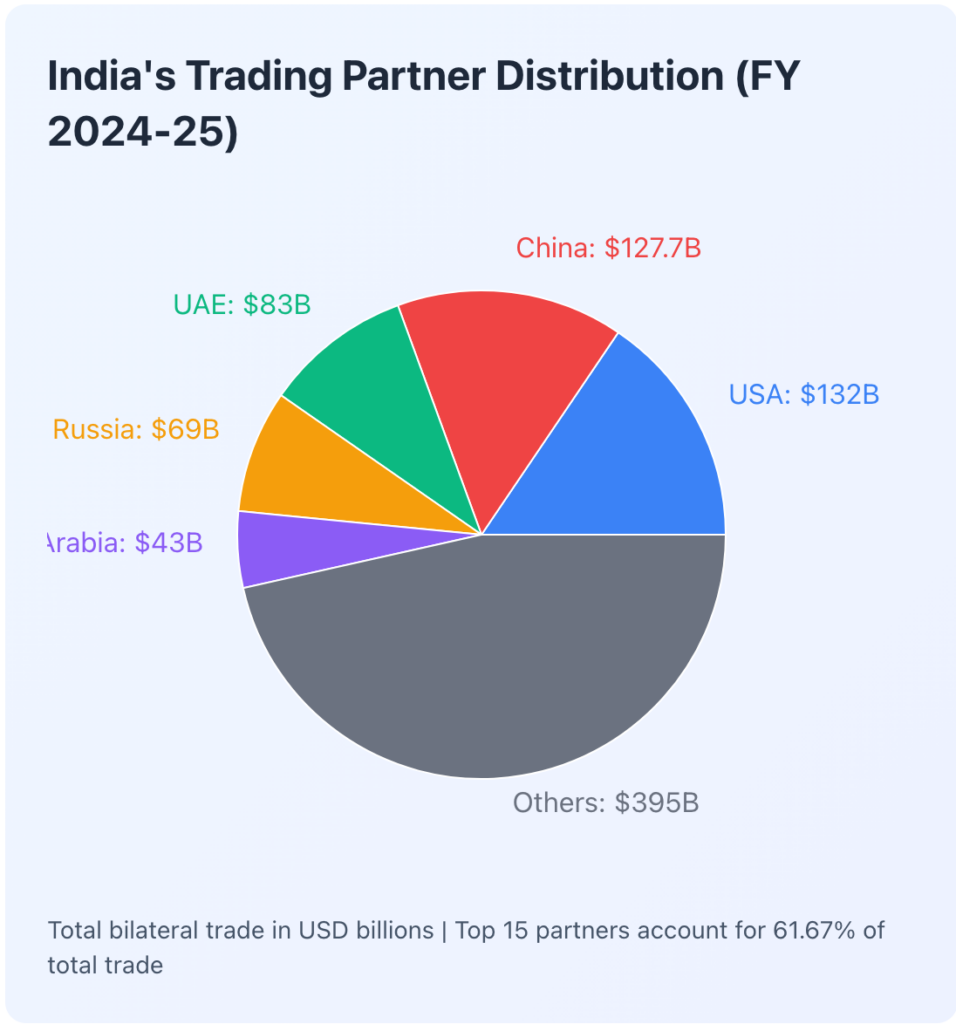
India’s trade relations with China are still the most important despite the ongoing conflict at the border and the local spoken campaigns. The trade between the two countries was valued at $127.7 billion in the financial year 2024-25, with China being responsible for 15.7% of India’s imports overall. The bond is very unbalanced: India mainly takes in high-value manufactured items – electrical machinery ($38 billion), nuclear reactors and parts ($25.9 billion), and organic chemicals ($13.3 billion) – and sends out mainly raw materials like iron ore, cotton, and marine products valued at only $14.3 billion.
One of the industries that has shown the most dependence on this relationship is the electronics industry. India, although, has successfully increased smartphone exports to $38.56 billion in the fiscal year 2024-25 (which is an eight-fold increase over a decade), has also to import $36.8 billion in electronic components, and 40% of them are from China. India’s import of integrated circuits from China is 88%, laptops and PCs 77.7%, and lithium-ion batteries for electric vehicles 75%. Even though Apple’s exports from India saw a 42% increase, taking the total to $12.8 billion in 2024, the number of suppliers from the company’s Chinese contractor base has grown to 15,7, as against only 14 from India.
ASEAN: The Widening Imbalance
The ASEAN-India Free Trade Agreement (AIFTA), launched in the year 2010, presented the notion of mutual prosperity, but in actuality, it has produced an uneven result. Between FY 2009 and FY 2023, the increase in India’s imports from ASEAN was 234.4% while that of exports was only 130.4%. The trade imbalance rose from $7.5 billion in 2011 to around $44 billion by 2023. Exports from India to ASEAN grew at a CAGR of merely 2.43% when compared to 3.11% to the entire world, which is a clear indication of lost market share.
Singapore and Vietnam proved to be especially troublesome partners. The number of ASEAN countries with which India has trade deficits is now seven out of ten, which is an increase from five in 2008-09. The production base of ASEAN is mainly directed towards export, which, combined with an asymmetric negotiation structure (India made one consolidated offer while each ASEAN member made separate offers), has put Indian industries at a disadvantage. The inverted duty structure on items like ferroalloys, aluminium, and chemical preparations gives a competitive edge to domestic manufacturers despite the Production-Linked Incentive schemes.
The Western Equation: EU and the United States
The narrative surrounding India’s relationship with Western allies is more balanced when viewed through the prism of the Western partners. The US has retained its position as India’s largest trading ally for the fourth year in a row, with the total trade between the two countries amounting to $132 billion in FY 2024-25. India’s product shipments to the US rose to $86.51 billion (from $77.51 billion in FY24), resulting in a favourable goods trade surplus worth $45.8 billion. The services sector is another angle, with the trade of services between the US and India at $83.4 billion, almost equitably split between exports and imports.
The EU, which is the second-largest trading partner for India, had a total of €120 billion in trade of goods with India in 2024 (corresponding to 11.5% of the total trade of India). The volume of trade between India and the EU in various products nearly doubled during the period from 2014 to 2023, with the exports from India growing at a CAGR of 4.9% and those from the EU at 8.6%. In 2024, the EU’s import of goods from India amounted to $77.06 billion, which chiefly consisted of machinery, chemicals, textiles, and base metals, while the EU’s exports to India were $52.34 billion, resulting in India having a positive trade balance. On the other hand, the services trade reflects an EU deficit of €7.9 billion, whereas the EU’s FDI stock in India climbed to €140.1 billion in 2023, thus marking it as the foremost foreign investor in the country.
Defence: Legacy Dependencies and Strategic Shifts
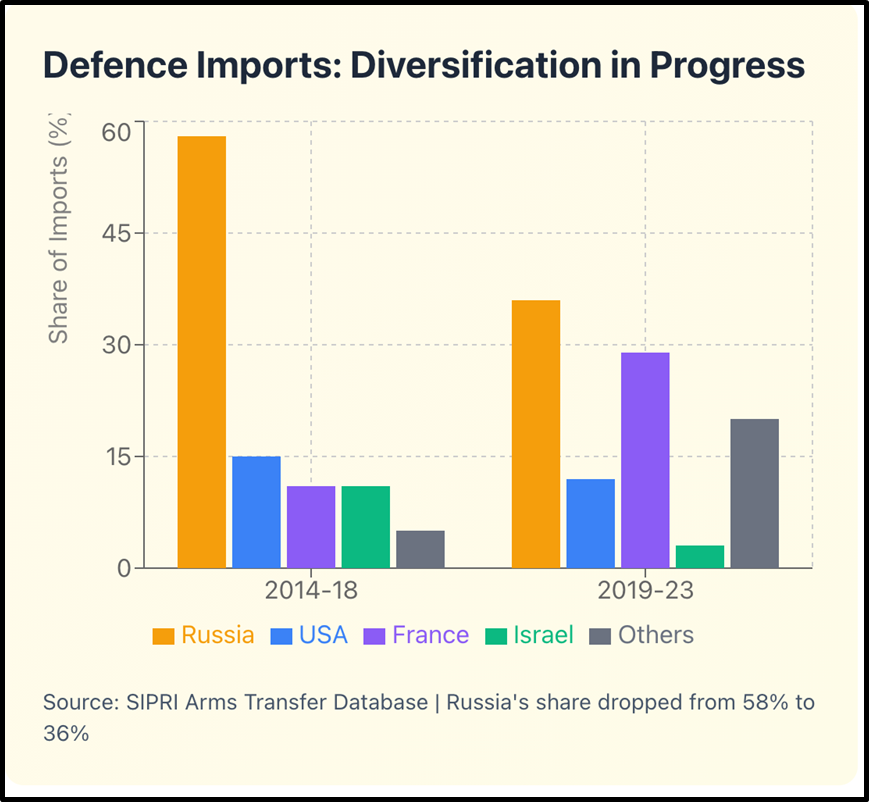
India’s defence sector is perhaps the biggest challenge in the dependency issue that is most strategic. In the past, around 90% of the Indian Army’s equipment had its roots in the Soviet Union and then Russia, for instance, T-90 and T-72 Battle Tanks, Su-30MKI fighter jets, Mi-series helicopters, S-400 air defence systems, etc. Russia was the main supplier of India’s defence imports, accounting for 68% of them during the years 2012-16, which amounted to $22.8 billion in the decade 2011-2021.
But then, the share of Russia started to fall sharply from 58% in the period 2014-18 to 36% in 2019-23, the very first interval after the 1960s when Russian exports made up less than half of India’s arms imports. This sped up after the invasion of Ukraine by Russia as Moscow found it difficult to fulfil the contracts. The May 2025 India-Pakistan battle brought to light the extent of the dependence on the past, as the bulk of the arms systems used were of Soviet-Russian origin.
At the same time, India started to develop defence cooperation with the USA. The US-India defence trade went from zero in 2005 to $146 billion in 2020, and it was even projected to cross the $200 billion mark by 2025. The US alone, in 2024, informed Congress about the potential arms sales worth over $5 billion. The February 2025 summit opened the door for advanced initiatives: COMPACT (Catalysing Opportunities for Military Partnership, Accelerated Commerce & Technology), TRUST (Transforming the Relationship Utilising Strategic Technology), and the deals for F-35 Fighter jets, co-production of F414 jet engines, and $4 billion in MQ-9B armed drones.
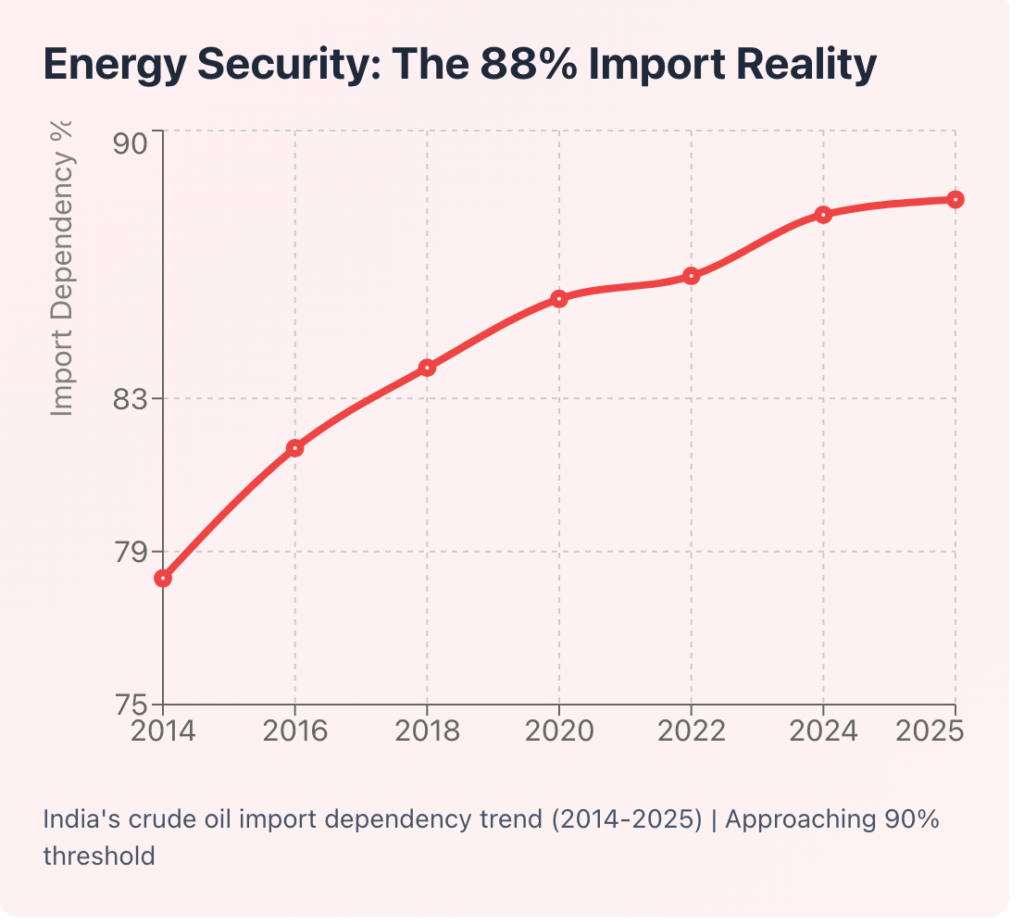
Energy: The 88.2% Constraint
Energy dependency is a point of no return for India as far as economics are concerned. During FY 2024-25, India imported 88.2% of its crude oil needs—the highest ever—$242.4 billion was spent on crude and $15.2 billion on LNG imports. The share of imports has gone up year after year from 2014, when it was 78.3%, due to the stagnation of domestic crude production at 28.7 million tonnes, even as the demand increased to 242.4 million tonnes.
The buyers changed widely after Russia invaded Ukraine. The 2.5% (less than 100,000 b/d) share of Russia in India’s imports of crude increased to 39% (1.8 million b/d) by 2023, thus pushing out the traditional Middle Eastern suppliers. The oil coming from Russia was cheap; India paid $525.60 per ton for it compared to $564.46 for the Iraqi oil, and this saved India about $2.7 billion at the very start, although the figures for total savings till 2024 differ a lot ($10.5-$25 billion).
Nevertheless, the change in crude supply brought about new dependencies and political issues as well. The trade between India and Russia went up six times, from $10 billion in 2022 to $69 billion in FY 2024-25, but the makeup was very much unequal: $63.84 billion in imports (mainly oil) versus only $4.88 billion in exports. The disparity resulted in a rupee accumulation problem for India in Russia, which made the payments for defence equipment difficult. Dependency on natural gas is 50.8% and 66.3% of the LNG imports are from the Middle East, but US LNG exports to India increased by 42 billion cubic feet in 2023.
Policy Responses and Strategic Reality
India has put forth a complete policy toolkit in order to deal with these dependencies. The Production-Linked Incentive (PLI) scheme spent a total of ₹1.97 lakh crore over the course of fourteen sectors, electronics, and pharmaceuticals included. The “Atmanirbhar Bharat” campaign is supporting local industry, while the Positive Indigenisation Lists curtail imports concerning more than 5,500 items classified as defence. The Electronic Components Manufacturing Scheme (ECMS) is a $2.7-billion plan that helps to minimise component imports. The blending of ethanol with gasoline saved $12.8 billion in foreign exchange by September 2024, and projects such as PM-KUSUM and the National Green Hydrogen Mission are expected to add up to 500 GW of non-fossil fuel capacity by 2030.
However, data also show that there are gaps in implementation. Even though PLI schemes are in place, the local value addition in the smartphone sector is a mere 15% as against the target of 35-40%. The CAROTAR rules (which require importers to authenticate the origin) led to WTO complaints from Indonesia, Malaysia, Japan, and South Korea. The AIFTA review process, initiated in 202,3, has already gone through five rounds of negotiations but is still stuck on Rules of Origin and tariff cuts. Indigenisation in defence is progressing but still dependent on Russian spares for the remaining Su-30MKI fighters and T-90S tanks (comprising 270 and 1,000, respectively) of the old platforms with a combined production value of ₹1.27 lakh crore or $15 billion in FY 2023-24.
The Verdict: Constrained Autonomy
The data from 2014 to 2025 presents a paradox whereby, despite significantly expanding the GDP, with a near approaching $4 trillion, a trade that is 50% bigger, and multiplying policy initiatives, strategic dependencies have deepened in critical sectors. The $99.2 billion trade deficit with China, 88.2% crude oil import dependency, 62% reliance on Chinese electronic components, and legacy defence platform dependencies bind together in constraining India’s freedom of geopolitical manoeuvre.
“Strategic autonomy” in its genuine sense-the ability to pursue independent foreign policy choices without external economic leverage-remains aspirational rather than actual. The February 2025 crisis, when the Trump administration threatened 50% tariffs over India’s Russian oil purchases, epitomised this constraint. India’s response required diplomatic agility precisely because economic dependencies limited harder responses.
The path forward requires sustained investment in domestic capabilities, diversification of supply chains beyond single-source dependencies, and realistic timelines. The transition from Russian to Western defence platforms will take 15-20 years, given platform life cycles. Electronics indigenisation requires building an entire component ecosystem, not just assembly lines. Energy security demands both renewable capacity-already growing at 6% and strategic petroleum reserves beyond the current 10-day supply.

India’s pursuit of strategic autonomy is thus better described as “constrained autonomy”-the ability to manoeuvre within limits set by economic dependencies that cannot be wished away through policy declarations. What the data shows is that real autonomy needs not just intent, but decades of investment in domestic capabilities across electronics, energy, and defence manufacturing. Till then, India’s foreign policy will of necessity operate within boundaries drawn by the very trade dependencies this analysis has mapped.
Divyanka Tandon holds an M.Tech in Data Analytics from BITS Pilani. With a strong foundation in technology and data interpretation, her work focuses on geopolitical risk analysis and writing articles that make sense of global and national data, trends, and their underlying causes. Views expressed are the author’s own.