Russia’s trade geography has changed as a result of Western sanctions that have been in place since the country annexed Crimea in 2014 and were significantly increased following the full-scale invasion of Ukraine in February 2022. The US, EU, UK, and other partners implemented price caps, export controls, bans, and financial restrictions in an effort to limit Russia’s access to capital, technology, and income. The outcome has been a dramatic reorientation rather than a complete collapse of Russian trade, with increased ties with non-Western partners, especially China and India, offsetting decreased commerce with advanced economies. This article examines how Russia’s trade flows have changed and what the new trends mean for the efficacy of sanctions using publicly available data (UN Comtrade, IMF DOTS/IMTS, China Customs, and Indian official statements).
Methods and Data Sources
We use publicly available statistical sources to examine merchandise trade at the partner level. Harmonised bilateral flows are provided by UN Comtrade, cross-checked partner estimates are provided by the IMF’s International Trade in Goods (IMTS, formerly DOTS), and current-year totals are provided by national sources such as China’s General Administration of Customs. We use press reports and statements from Indian officials that reflect fiscal-year totals for trade between India and Russia. Market shares and energy composition are based on the National Bureau of Asian Research (NBR) sectoral analysis. Small differences between sources are expected due to different methodologies and timing (calendar vs. fiscal year; USD vs. CNY). Figures are presented at annual resolution or point-in-time snapshots to illustrate structural changes.
The China Pivot: Record Highs Despite Headwinds
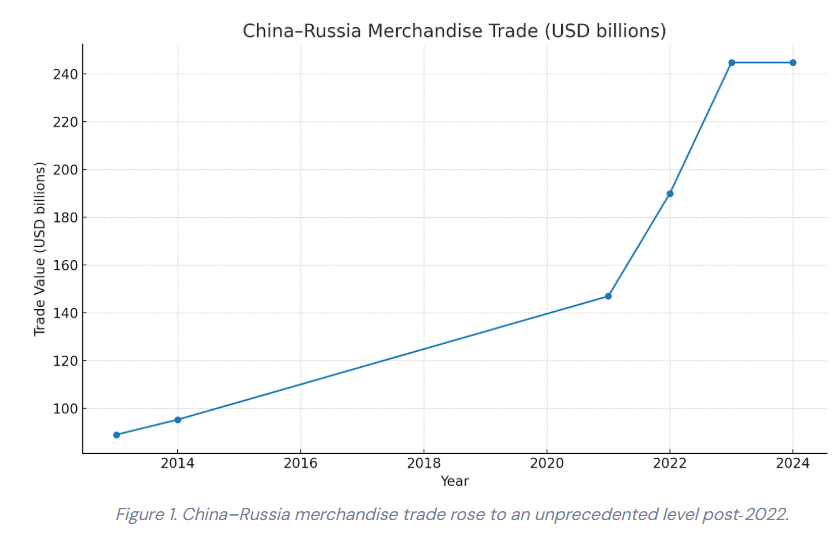
China has emerged as Russia’s unsinkable trade ally since 2022. Having oscillated for years between around $90–$110 billion, two-way commerce sped up: around $147 billion in 2021, around $190 billion in 2022 when Western companies pulled out of Russia, and a record-high near $245 billion in 2023–2024 in Chinese customs records.
Growth receded in 2024–2025 as secondary-sanctions threats tightened and payment frictions arose, but the new plateau remains significantly higher than pre-war levels. Russian exports to China are dominated by oil, gas, and commodities, with Chinese exports of machinery, consumer goods, electronics, and dual-use-adjacent products. The peak usage of renminbi for settlement (around 40% of Russia’s trade in early 2024) highlights financial decoupling from the dollar/euro system. Nonetheless, recent US actions against third‑country banks have started to blunt the pace, as reports of year‑to‑date slowdowns in 2025 attest.
India’s Oil‑Driven Surge: From Marginal Partner to Top Energy Outlet
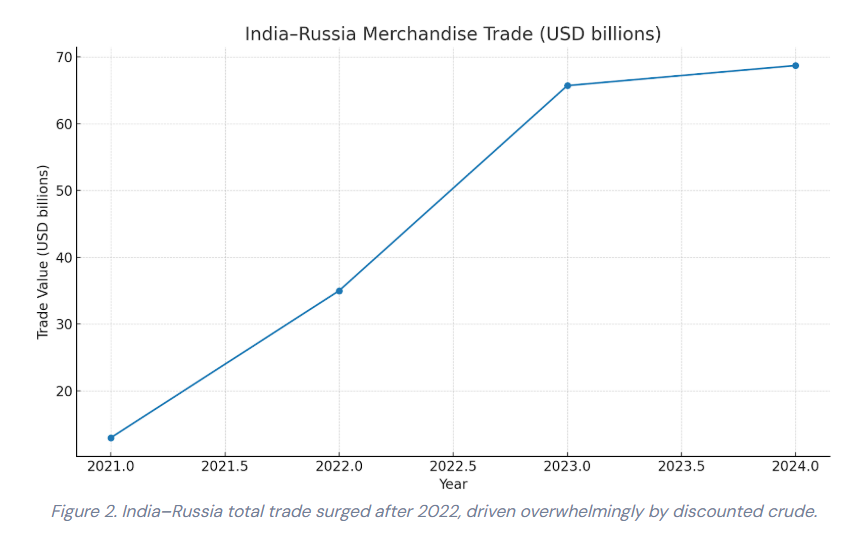
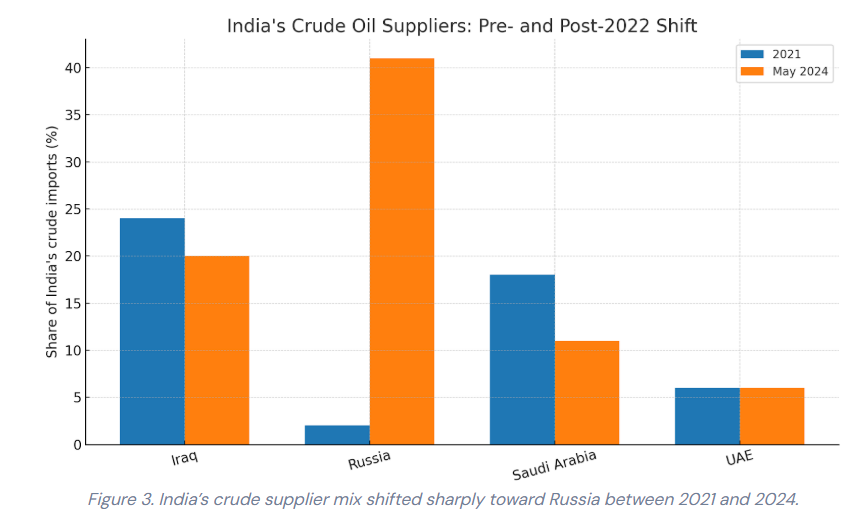
India’s economic relations with Russia changed most prominently via crude oil commerce. Before 2022, the Russian contribution to India’s crude imports had been negligible (low single digits). The G7/EU price cap, sanctions, and reconfigured flows created a discount window that Indian refiners took advantage of at scale. By May 2024, Russia contributed approximately 41% of India’s crude imports (NBR), ahead of Iraq and Saudi Arabia. This energy flow drove overall bilateral commerce from about $13 billion in 2021 to ~$35 billion in 2022 and around $65–69 billion in 2023–2024—an unprecedented value and Russia’s contribution to India’s energy mix. The trade is heavily unbalanced, though: Russian imports (principally crude) greatly overshadow Indian exports (pharmaceuticals, machinery, agri.), generating a deficit of approximately ~$59 billion by 2025, which has been publicly identified as unsustainable by Indian policymakers.
How Sanctions Rewired Trade Networks
The reorientation is explained by four mechanisms:
• Price arbitrage and rerouting: Significant reductions in the price of Russian crude were brought about by the G7 price cap and the European embargo. By purchasing barrels at a discount and exporting refined goods all over the world, China and India were able to seize value.
• Payment system fragmentation: Trade shifted towards non-Western banks and currencies (CNY, AED, TRY, and INR), increasing transaction frictions while preserving flows, as major Russian banks were cut off from SWIFT and dollar/euro clearing.
• Western suppliers left Russia: Sanctions and corporate self-sanctioning created room for Chinese and other non-Western companies to replace European consumer goods, automobiles, and technology.
• Enforcement externalities: The network’s sensitivity to the severity of enforcement, not just the blacklist, was highlighted by the threat of secondary sanctions on third-country banks in late 2024/2025, which slowed China-Russia growth.
Did Sanctions Reduce Russia’s Revenues?
Sanctions increased the cost of doing business for Russia and limited its access to exclusive OECD markets. Nevertheless, export revenue was not eliminated by the combination of increased logistics costs, growing discounts, and energy rerouting (to Asia). Rather, it redistributed margins and trade. While some rent was transferred to Asian refiners and traders through discounts, the price cap limited windfall gains in 2023–2024 in comparison to unconstrained prices. Netbacks are further compressed over time by tighter enforcement and restricted access to services (finance, insurance, and shipping). The significant slowdown in the China-Russia turnover rate in 2025 serves as an example of how the design of sanctions and their enforcement frequency significantly influence results.
Network Analysis Perspective
From the perspective of the trade network, Russia’s degree of centrality with advanced economies decreased, but its weighted ties with a group of non-Western partners grew stronger. The system demonstrates substitution along commodity chains: consumer goods and machinery pivot west-to-east into Russia, while crude and commodities pivot east. From USD/EUR nodes, financial edges rewire towards CNY/AED hubs. The long-term question of whether sanctions hasten bloc formation and payment system bifurcation is brought up by this reconfiguration.
Policy Implications for Sanctions Design
• Targeted enforcement issues: Trade growth in 2025 was slowed by secondary sanctions and due diligence requirements for third-country banks, indicating that slight tightening can have an impact without sweeping new policies.
• Chokepoints for services are crucial: In a world where physical cargoes can still be rerouted, restrictions on shipping, insurance, and financing services provide leverage.
• Keep an eye out for leaks in dual-use products: Continuous monitoring of transhipment routes and intermediaries is necessary for controls on semiconductors, machine tools, and components.
• Anticipate ongoing non-Western substitution: China and India have established roles in Russia’s trade portfolio after 2022, particularly for energy and manufactured imports; any rollback will rely on domestic policy decisions and global pricing dynamics.
Limitations and Caveats
Perfect comparisons are complicated by cross-source differences (calendar versus fiscal year, USD versus local currency, re-exports). Reporting lags are also caused by compliance practices and payment frictions. Therefore, rather than focusing on precise accounting identities, the above charts highlight structural direction and orders of magnitude. Refer to the IMF IMTS partner series and UN Comtrade microdata for detailed product analysis (HS codes, unit values).
References (selected):
- UN Comtrade Database – https://comtrade.un.org/
- IMF International Trade in Goods (IMTS/DOTS) – https://data.imf.org/
- Reuters (Jan 13, 2025). China–Russia trade hits record (~$245b) based on China Customs.
- Reuters (May 17, 2024; Jul 5, 2024). India–Russia trade: ~$65.7 billion in FY2023/24; focus on correcting the imbalance.
- NBR (May 2024). Oil for India – Russia’s share ~41% of India’s crude imports (May 2024).
- MERICS China–Russia Dashboard – Surge in CNY settlements; payment headwinds in late 2024/25.
Appendix: Reproducibility Notes
The sources mentioned above are used to compile the data points in charts. By choosing the correct reporter/partner pairs, calendar or fiscal years, and HS “TOTAL” aggregates, a reader can replicate the China–Russia and India–Russia bilateral totals using UN Comtrade and IMF IMTS. Indian import data and sectoral analyses (such as NBR) can be used to reconstruct India’s share as a crude supplier. Due to reporting periods and currency conversion, there will be slight variations.
Divyanka Tandon holds an M.Tech in Data Analytics from BITS Pilani. With a strong foundation in technology and data interpretation, her work focuses on geopolitical risk analysis and writing articles that make sense of global and national data, trends, and their underlying causes. Views expressed are the author’s own.