A Deep Data Analysis of Rerouting Patterns, Freight Costs, Chokepoint Risks, and India’s Strategic Imperatives (2024–2026)
- A single attack triggered a cascading maritime crisis that, by 2025, had fundamentally redrawn global shipping geography.
- By February 2024, large container tonnage crossing the Suez Canal had collapsed by 82%.
- The gap between actual costs and charged rates reveals how shipping carriers used the crisis to extract significant margin — a dynamic Xeneta analysts described as carriers ‘acting opportunistically.’
- The convergence of Red Sea instability, Hormuz risk, and Malacca congestion represents not a temporary geopolitical shock, but a structural transformation in the economics of global trade.
The Crisis That Rewrote Shipping Maps
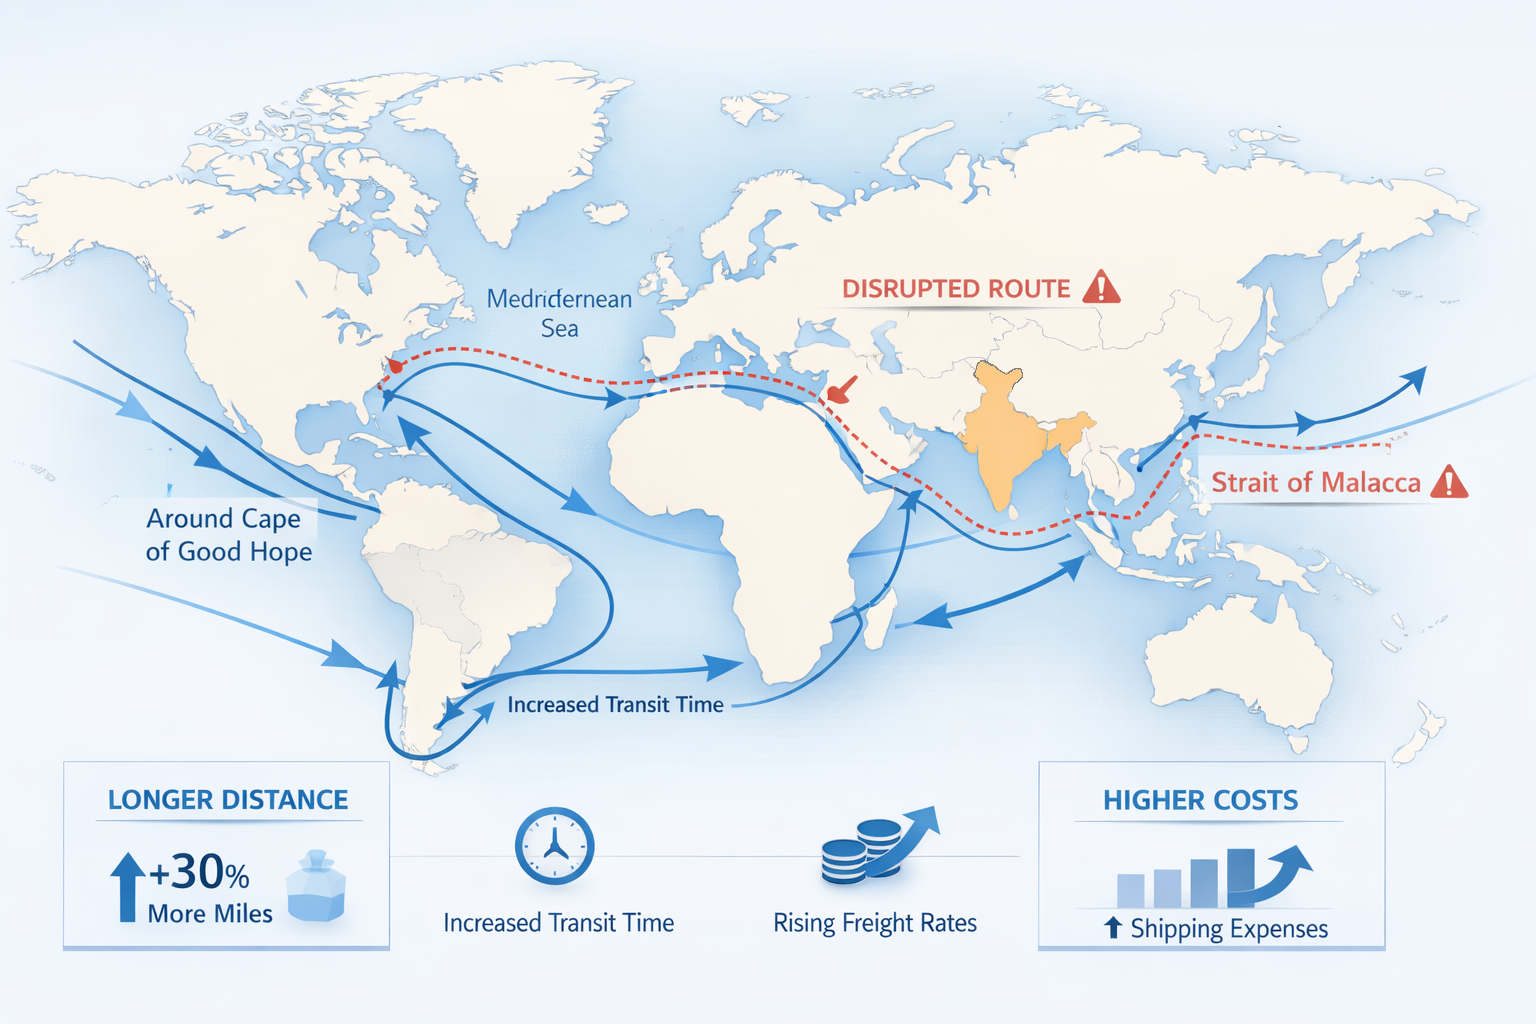
On November 19, 2023, a Houthi drone struck the Galaxy Leader cargo ship in the Red Sea. That single attack triggered a cascading maritime crisis that, by 2025, had fundamentally redrawn global shipping geography. Over 190 Houthi attacks followed through October 2024, forcing the world’s largest shipping lines — Maersk, MSC, CMA CGM — to abandon the Suez Canal corridor entirely. By February 2024, large container tonnage crossing the Suez Canal had collapsed by 82%. By May 2025, overall Suez traffic was still 70% below 2023 levels, according to UNCTAD data.
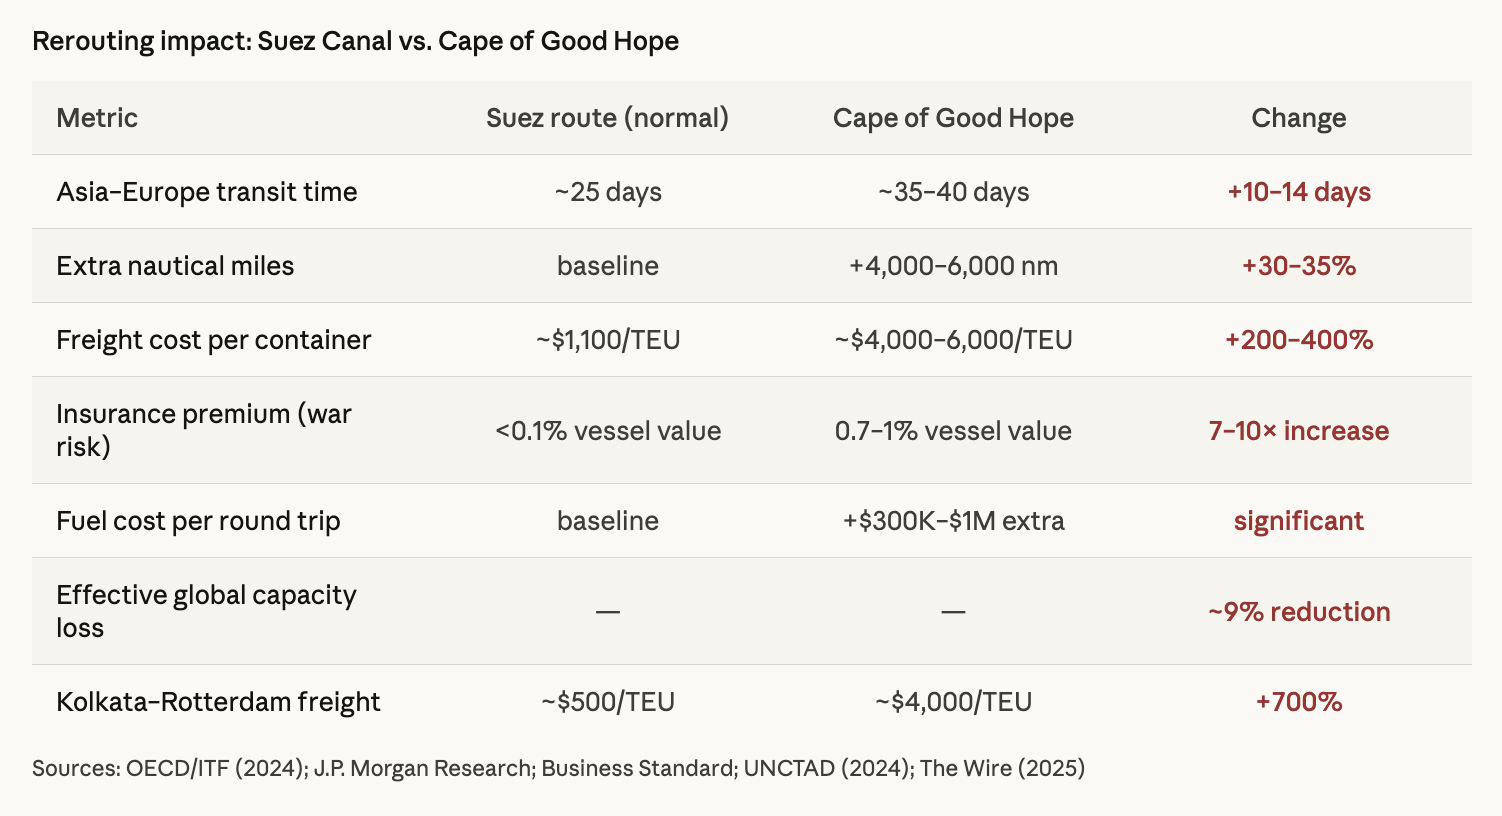
The numbers that followed are stark. The Suez Canal normally handles 30% of global container trade and 12% of all world commerce. When it effectively shut down for commercial vessels, ships were forced onto the Cape of Good Hope detour — adding 4,000 to 6,000 nautical miles per voyage, and extending Asia-Europe transit times by 10 to 14 days. J.P. Morgan Research estimated this rerouting equated to roughly a 9% reduction in effective global container shipping capacity. Ton-miles — the weight of cargo multiplied by distance travelled — hit a record 6% rise in 2024, nearly three times faster than actual trade volume growth (UNCTAD, 2025).
Freight Rates: The Price of Geopolitics
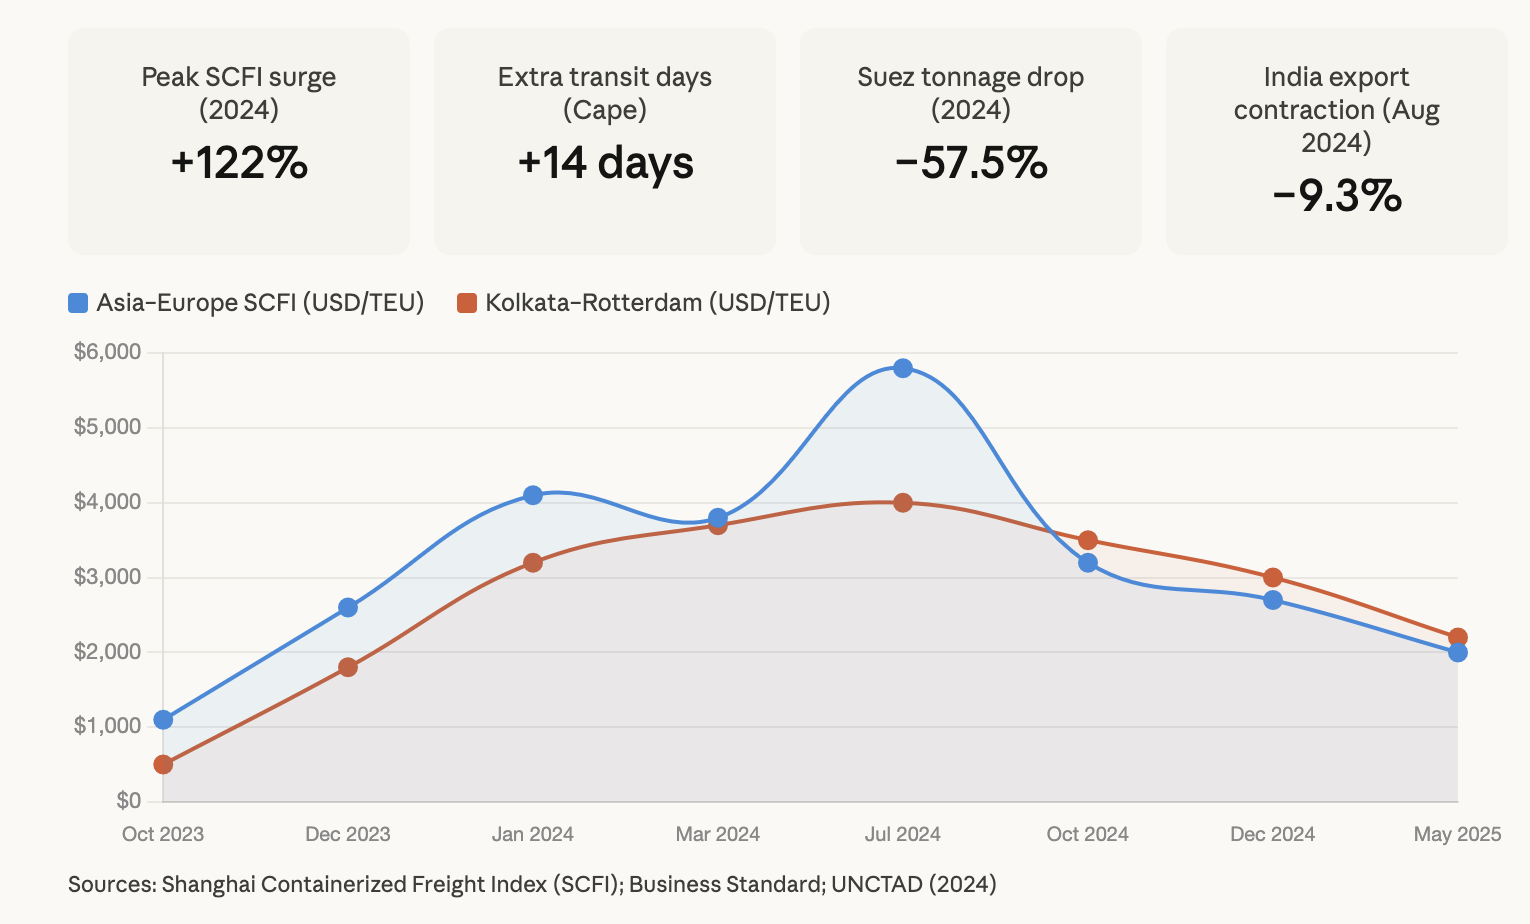
The freight rate surge of 2024 was sudden, steep, and historically significant. The Shanghai Containerised Freight Index (SCFI) more than doubled between late 2023 and mid-2024, reaching near-COVID-era peaks before moderating by year-end. Specific routes told an even sharper story: the Far East–Europe container rate jumped 220% between December 2023 and January 2024 alone, rising from $852 to $2,723 per 20-foot equivalent unit (TEU). The Far East–Mediterranean route surged 198% in the same window (OECD/ITF, 2024).
For Indian exporters, the cost shock was more severe than global averages. The Kolkata–Rotterdam freight rate — India’s primary export corridor to Europe — rocketed from approximately $500 per TEU before the crisis to $4,000 per TEU at its peak, an 700% increase. By contrast, the actual additional cost of rerouting a medium-sized container ship around the Cape of Good Hope was only about $300 per 40-foot container in real operational terms (OECD/ITF, 2024). The gap between actual costs and charged rates reveals how shipping carriers used the crisis to extract significant margin — a dynamic Xeneta analysts described as carriers “acting opportunistically.”
War-risk insurance premiums exploded from under 0.1% of vessel value to 0.7–1% — a 7 to 10-fold increase that alone added hundreds of thousands of dollars per voyage. Per-round-trip fuel and labour costs from Cape routing added $300,000 to $1,000,000 for large vessels. The cumulative result: by mid-2024, Asia-Europe freight rates had stabilised at 25–35% above pre-crisis levels even after the initial spike eased (DocShipper, 2025). As of mid-2025, with Suez transits still 70% below normal, the Cape of Good Hope route has become the structural new normal — not a temporary detour.
The Chokepoint Constellation: India at the Intersection of Risk
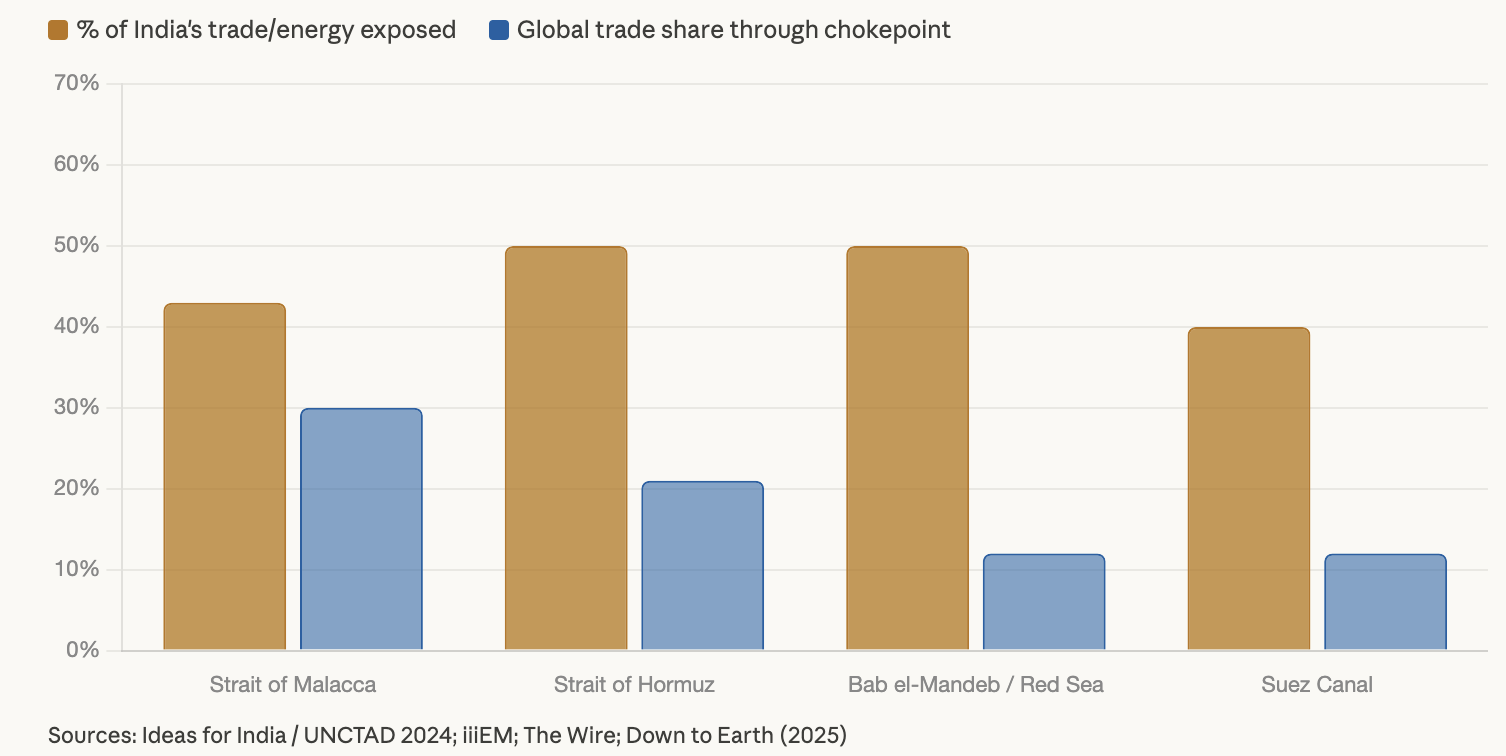
India’s vulnerability in this crisis is not incidental. It is structural, rooted in the geography of its trade. India sits at the centre of a chokepoint constellation: three of the world’s most critical maritime straits directly condition its economic performance.
The Strait of Malacca — the world’s busiest shipping lane — carries 24% of global seaborne trade, including 45% of seaborne crude oil. Approximately 40–45% of India’s total trade transits this corridor, including significant shares of petroleum and LNG imports to its eastern seaboard refineries (iiiEM, 2025). It has no practical alternative route.
The Strait of Hormuz is the world’s most critical oil transit chokepoint. India imports nearly 85% of its crude oil, with a substantial share — approximately half — transiting Hormuz. The EIA estimates that 84% of all crude transiting Hormuz in 2024 was headed to Asian markets, placing India in a category of maximum oil-route exposure. A closure of Hormuz, even temporary, would trigger severe domestic energy shocks within weeks.
The Bab el-Mandeb Strait and Suez Canal are the critical corridor for India’s trade with Europe, North America, and North Africa — a cluster that accounts for approximately 50% of India’s exports and 30% of imports (CRISIL Ratings, 2024). Any disruption cascades directly into Indian export revenues, import costs, and inflation.
The compounding effect of these exposures means India faces what analysts at Ideas for India (2025) describe as “chokepoint concentration risk” — the dangerous convergence of energy security, trade revenues, and supply chain stability into a small number of narrow, vulnerable waterways that India does not control.
India’s Trade Damage: Sector by Sector
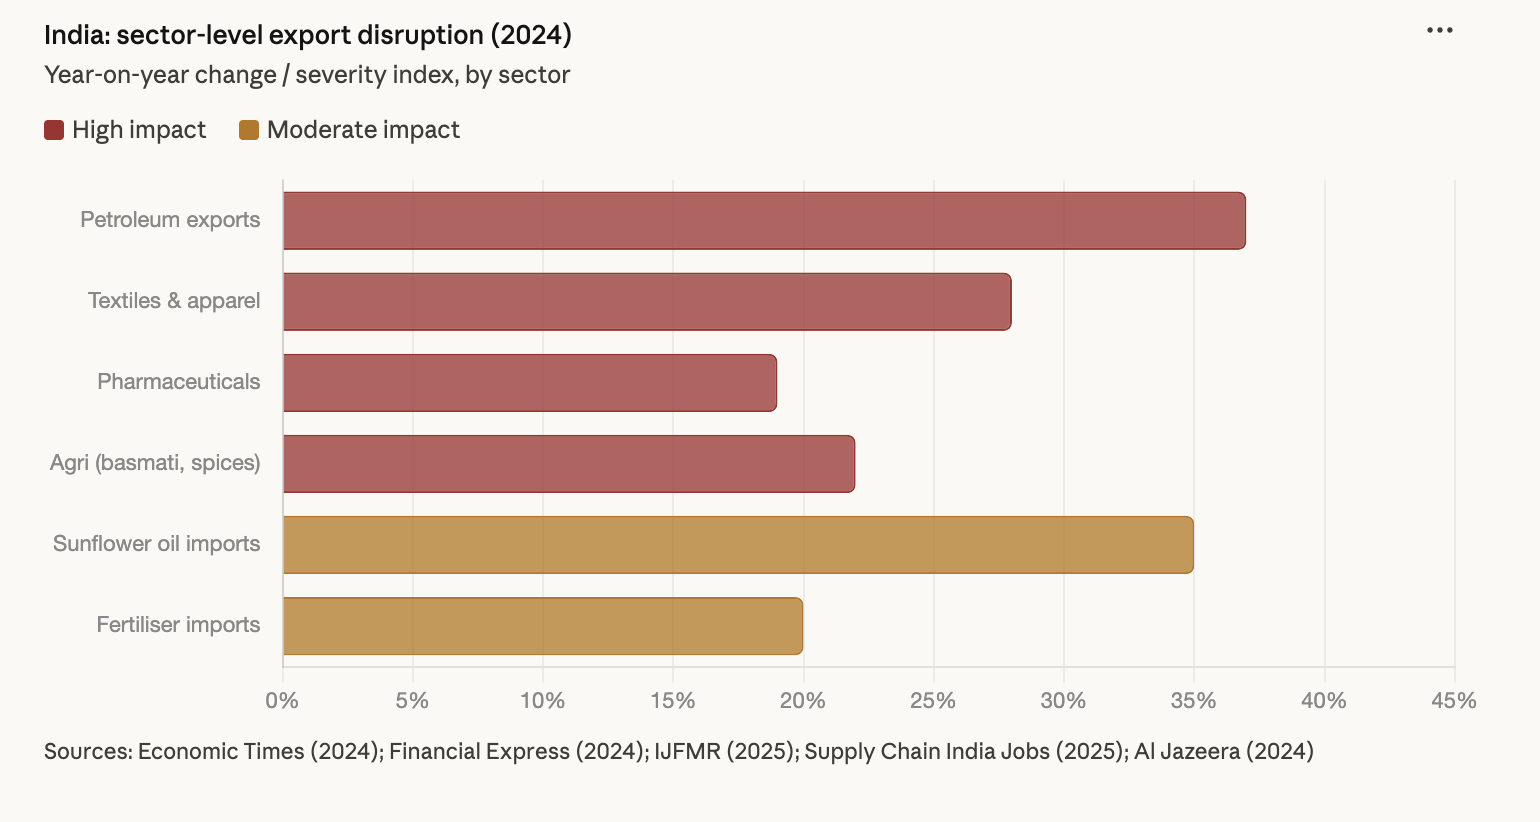
The damage from the 2024 Red Sea crisis was distributed unevenly across India’s export economy, but its depth was significant. India’s overall merchandise exports contracted by 9.3% in August 2024 (Economic Times, 2024). Petroleum product exports — which rely heavily on efficient westward shipping — fell by over 37% year-on-year. This is the single largest sector-level contraction attributable to the crisis.
Textiles and apparel, one of India’s largest labour-intensive export sectors, suffered as European buyers, facing extended lead times and higher costs, began exploring alternative sources. Pharmaceuticals — a sector where time-sensitive delivery is critical — saw their competitive advantage eroded as 21–28-day delays became the norm for Europe-bound shipments. Agricultural exports, including basmati rice, spices, and buffalo meat, were disrupted, with freight cost increases of 35% recorded on sunflower oil imports from Russia and Ukraine as Cape routing added 15 additional transit days.
The hardest-hit segment within India’s economy was MSMEs. These firms lack the freight hedging capabilities and financial buffers of large corporations. With Letters of Credit facing discrepancies due to longer shipment durations, many small exporters struggled to maintain client relationships, and some lost orders to competitors with shorter routes (Financial Express, 2024).
The import side also suffered. Fertiliser shipments were delayed, raising food-production input costs. Sunflower oil supply tightened sharply, with higher costs passed on to consumers. Machinery components and electronics faced delays that disrupted downstream manufacturing schedules.
Rerouting Patterns: The New Geography of Trade
The data from 2024–2025 reveals three distinct rerouting tiers that emerged as the crisis normalised:
Tier 1 — Permanent Cape routing: All major container carriers — Maersk, MSC, Hapag-Lloyd, Evergreen — adopted the Cape of Good Hope as the de facto standard for Asia-Europe container traffic. This added 4,000–6,000 nautical miles and 10–14 days per voyage, but eliminated exposure to Houthi missile and drone attacks that persisted even after Operation Prosperity Guardian and the EU’s Operation Aspides were launched.
Tier 2 — Transhipment hub diversification: Indian exporters began restructuring their logistics through alternative hubs. Colombo (Sri Lanka), Jebel Ali (UAE), and domestic ports like Mundra and Chennai received increased traffic as shippers avoided single-corridor exposure. This structural shift reflects a strategic realisation that India’s port infrastructure must evolve from a single-route model to a multi-hub architecture.
Tier 3 — Near-shoring and supply chain compression: Global buyers responding to Red Sea instability began accelerating near-shoring — locating production closer to consumption markets. India, paradoxically, benefited partially from this trend: its PMI for manufacturing held above 50 throughout the crisis period, and its projected share of global smartphone production rose from 18% in 2024 toward 25–28% by 2026 (Supply Chain India Jobs, 2025). But Indian exporters also lost some European market share to closer competitors.
India’s Strategic Response: Navy, Diplomacy, and Infrastructure
India’s response to the shipping crisis has been multi-dimensional. The Indian Navy significantly expanded its mission-based deployments in the northern Indian Ocean, coordinating with the Combined Maritime Forces in Bahrain, and strengthening its operational presence around the Andaman and Nicobar Islands, which overlook the sea lanes approaching the Strait of Malacca (Chaturvedi, 2025).
On the infrastructure front, India’s investment in Iran’s Chabahar port — designed as an alternative trade corridor to Afghanistan and Central Asia, bypassing Pakistan — has taken on heightened significance as a route diversification asset. India has also expanded its Strategic Petroleum Reserves (SPR) stored in underground coastal caverns to buffer against short-term supply disruptions. Crucially, India’s significant shift toward Russian crude oil — with Russia accounting for over one-third of India’s oil imports by 2024 — has altered the flow geography, with Russian oil largely bypassing Hormuz and the Red Sea via Cape routing or overland connections (Al Jazeera, 2024).
The Federation of Indian Export Organisations (FIEO) estimates that as India moves toward its $1 trillion export target, transport service remittances could reach $200 billion annually by 2030. An Indian merchant shipping fleet large enough to capture even 25% of that volume could save $50 billion per year — a strategic imperative that the crisis has made impossible to ignore.
Looking Ahead: Structural Risk, Not Temporary Shock
The Red Sea crisis has entered its third year as of early 2026, with no full normalisation in sight. A fragile ceasefire in October 2025 led to some tentative Suez returns, but major carriers maintain Cape-first policies due to persistent insurance premiums and crew safety concerns. UNCTAD’s Review of Maritime Transport 2025 projects maritime trade growth slowing to just 0.5% in 2025, with global shipping emissions up 5% in 2024 from longer routes.
The Strait of Malacca — already absorbing increased traffic as an alternative corridor — reported over 130 piracy and security incidents in 2025. Any escalation in China–India–US geopolitical tensions over Malacca would compound India’s exposure dramatically.
For India, the data present an unambiguous strategic prescription: the country cannot achieve its $5 trillion GDP ambition while remaining as dependent as it currently is on chokepoints it does not control. The convergence of Red Sea instability, Hormuz risk, and Malacca congestion represents not a temporary geopolitical shock, but a structural transformation in the economics of global trade — one that demands India accelerate port infrastructure development, build a competitive merchant fleet, deepen naval partnerships across the Indian Ocean, and diversify its trade routes with the urgency that the data demands.
References and Data Sources:
- UNCTAD — Review of Maritime Transport 2025 (September 2025). https://unctad.org/news/maritime-trade-under-pressure-growth-set-stall-2025
- UNCTAD — High Freight Rates Strain Global Supply Chains (October 2024). https://unctad.org/news/high-freight-rates-strain-global-supply-chains-threaten-vulnerable-economies
- UNCTAD — Impact on Global Trade of Disruption of Shipping Routes (2024). https://unctad.org/system/files/official-document/osginf2024d2_en.pdf
- J.P. Morgan Research — The Impacts of the Red Sea Shipping Crisis (2024). https://www.jpmorgan.com/insights/global-research/supply-chain/red-sea-shipping
- OECD/International Transport Forum — The Red Sea Crisis: Impacts on Global Shipping and the Case for International Co-operation (2024). https://www.itf-oecd.org/sites/default/files/repositories/red-sea-crisis-impacts-global-shipping.pdf
- Atlas Institute for International Affairs — The Red Sea Shipping Crisis (2024–2025): Houthi Attacks and Global Trade Disruption (March 2025). https://atlasinstitute.org/the-red-sea-shipping-crisis-2024-2025-houthi-attacks-and-global-trade-disruption/
- Ideas for India / The Wire — Maritime Chokepoints: India’s Energy and Trade Vulnerabilities and Strategic Responses (March 2025). https://m.thewire.in/article/trade/maritime-chokepoints-indias-energy-trade-vulnerabilities-strategic-responses
- IJFMR — The Red Sea Crisis and India’s Strategic Maritime Interests (2025). https://www.ijfmr.com/papers/2025/3/42570.pdf
- Al Jazeera — How Escalating Red Sea Crisis Poses Billions of Dollars of Risk for India (February 2024). https://www.aljazeera.com/economy/2024/1/31/how-escalating-red-sea-crisis-poses-billions-of-dollars-of-risk-for-india
- DocShipper — Red Sea Crisis Update: Route Alternatives & Cost Impacts (January 2026). https://docshipper.com/shipping/red-sea-crisis-update-route-alternatives-cost-impacts/
- Supply Chain India Jobs — Impact of Global Conflicts on India’s Supply Chain (March 2026). https://www.supplychainindiajobs.com/impact-of-global-conflicts-on-indias-supply-chain/
- Down to Earth — From the Strait of Hormuz to Malacca: Global Trade Relies Almost Entirely on These Five Narrow Waterways (March 2025). https://www.downtoearth.org.in/economy/from-the-strait-of-hormuz-to-malacca-global-trade-relies-almost-entirely-on-these-five-narrow-waterways
- Research and Information System for Developing Countries (RIS) — Impact on India’s Trade Due to Red Sea Disruptions (2024). https://ris.org.in/cmec/pdf/Commentary.pdf
- CRISIL Ratings — India Trade Exposure Data (2024). Cited via Al Jazeera.
- Xeneta — Red Sea Crisis Newsfeed and Ocean Freight Rate Analysis (2024). https://www.xeneta.com/blog/red-sea-crisis-newsfeed
- PMC / Nature — Systemic Impacts of Disruptions at Maritime Chokepoints (2025). https://pmc.ncbi.nlm.nih.gov/articles/PMC12644514/
- iiiEM — India’s Strategic Maritime Straits, Chokepoints and Canals: Lifelines of Its International Trade (2025). https://www.iiiem.in/blog/indias-strategic-maritime-straits-chokepoints-canals-lifelines-of-its-international-trade/
- Economic Times — India Export Contraction Data, August 2024.
- Business Standard — Kolkata–Rotterdam Freight Rate Data (2024).
- S&P Global / Reuters — Russian crude oil routing and India import data (2024).
Divyanka Tandon holds an M.Tech in Data Analytics from BITS Pilani. With a strong foundation in technology and data interpretation, her work focuses on geopolitical risk analysis and writing articles that make sense of global and national data, trends, and their underlying causes. Views expressed are the author’s own.