(Data Analysis Period: Till 2024)
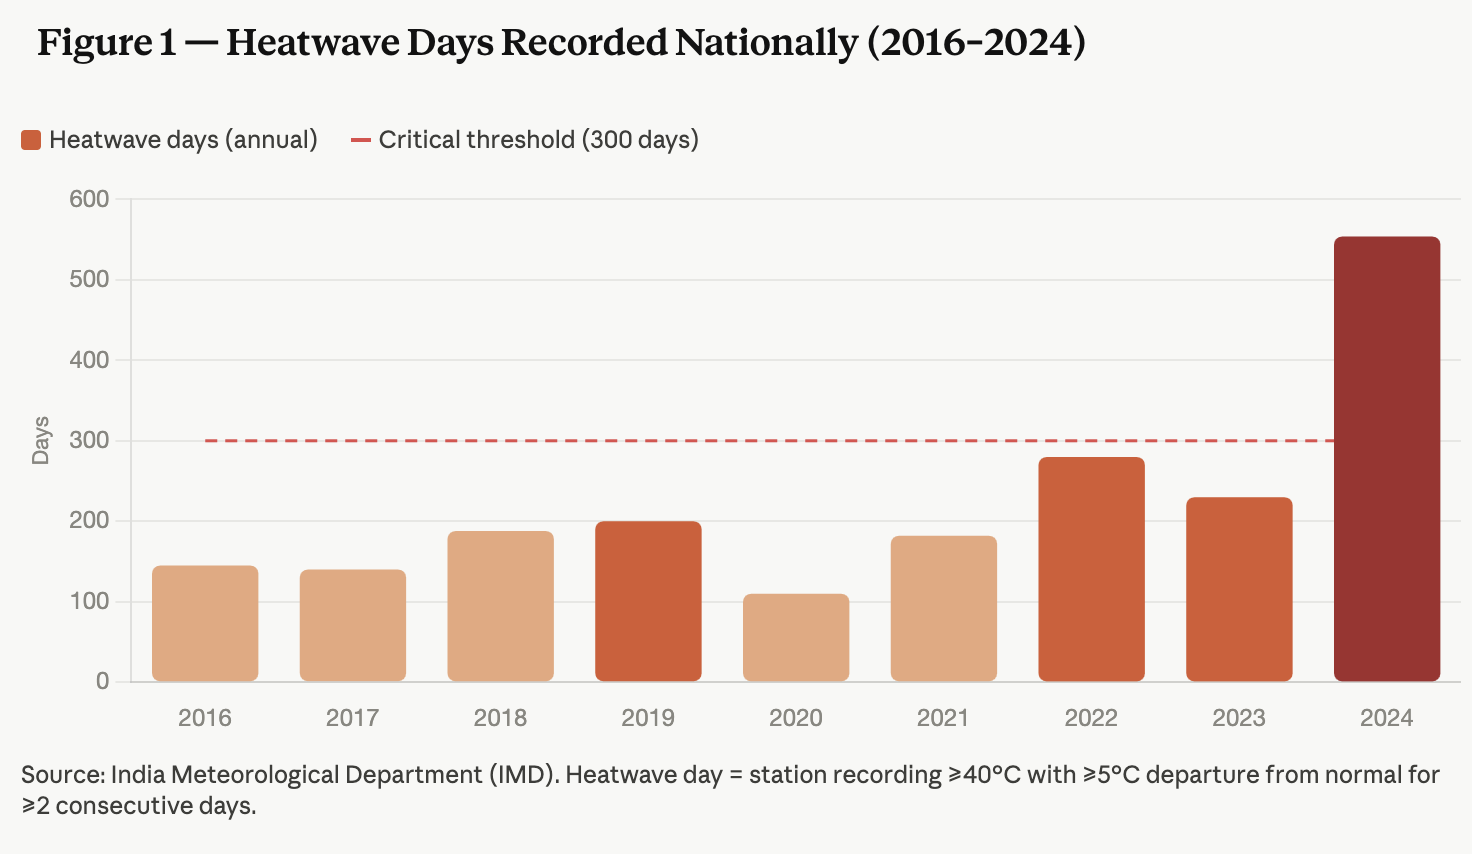
- India had 554 days of heatwaves in 2024. This is twice the number of days in the previous year, which was 230 days.
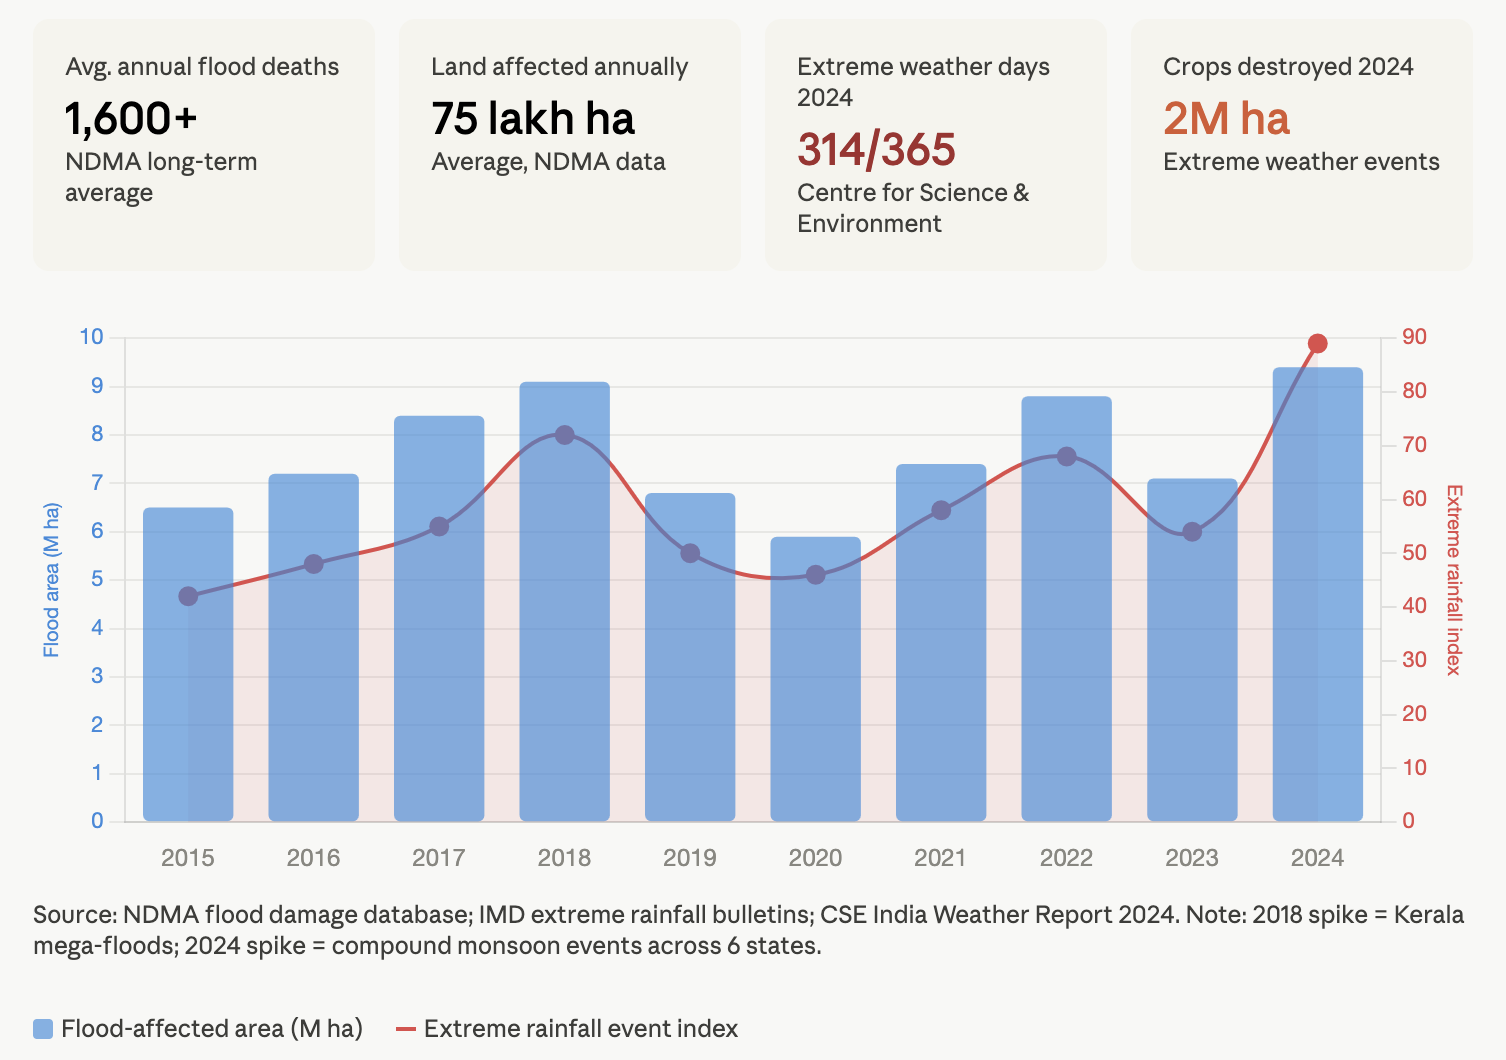
- In 2024, India saw weather events on 314 out of 365 days. The years 2023 and 2024 sit at anomalies of +0.65°C and +0.71°C, respectively, the two highest on record.
- Heat stress is a problem, and India needs to think about how to deal with it.
- Agriculture is going to be impacted by climate change, with wheat and maize yields dropping by as much as 45% and 20% by 2070 if the Earth gets very hot.
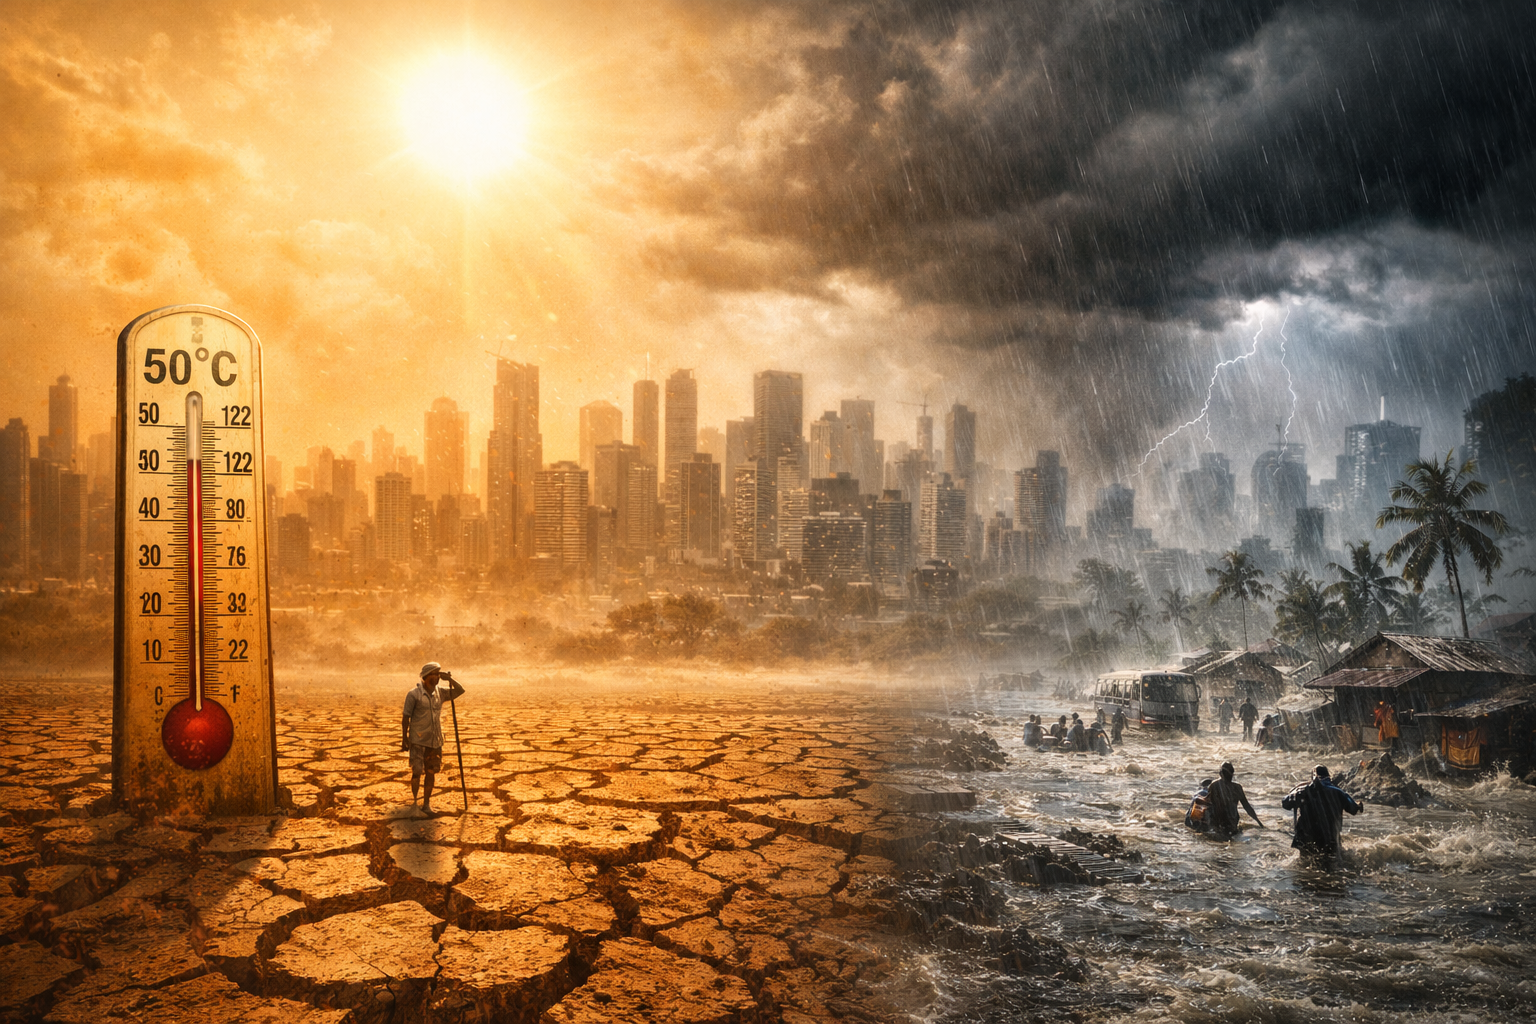
The Mercury Won’t Stop Climbing
The summer of 2026 in India is very hot. It feels like it is burning. In a place called Churu in Rajasthan, the temperature went up to 50.5°C. This is the kind of temperature that makes you think your thermometer is not working correctly. In Mungeshpur, which is in Delhi, the temperature went up to 52.9°C for a little while. The people in charge said that the thermometer was not working properly. Without any problems with the thermometer, Delhi was still very hot, almost 50°C. People had to stand in line for a time to get water from tankers even after the sun went down.
This is not about one summer that is very hot. This is a story that has been happening for a time, a slow and steady increase that you can see in the numbers, which keep going up every year.
Just look at these numbers: India had 554 days of heatwaves in 2024. This is twice the number of days in the previous year, which was 230 days. The India Meteorological Department says that it is not just because of warming. The weather patterns are not normal, and the soil is dry. It heats up fast, and there is a high-pressure system over the area that keeps the hot air from moving. It is like putting a lid on boiling water and making the heat stronger.
The numbers are very clear about what’s happening. From 2016 to 2021, India had between 110 and 200 days of heatwaves every year. This was already very bad. Then, in 2022, it jumped to 280 days, and many states had to declare an emergency. By 2024, the number of heatwave days had almost doubled again. The decade from 2001 to 2010 was the hottest on record in India, with temperatures that were 0.4°C higher than normal, which is 0.2°C higher than the previous decade. Every decade after that, India’s summer just keeps getting hotter and hotter, breaking the record every time.
Which States Are Burning Most?
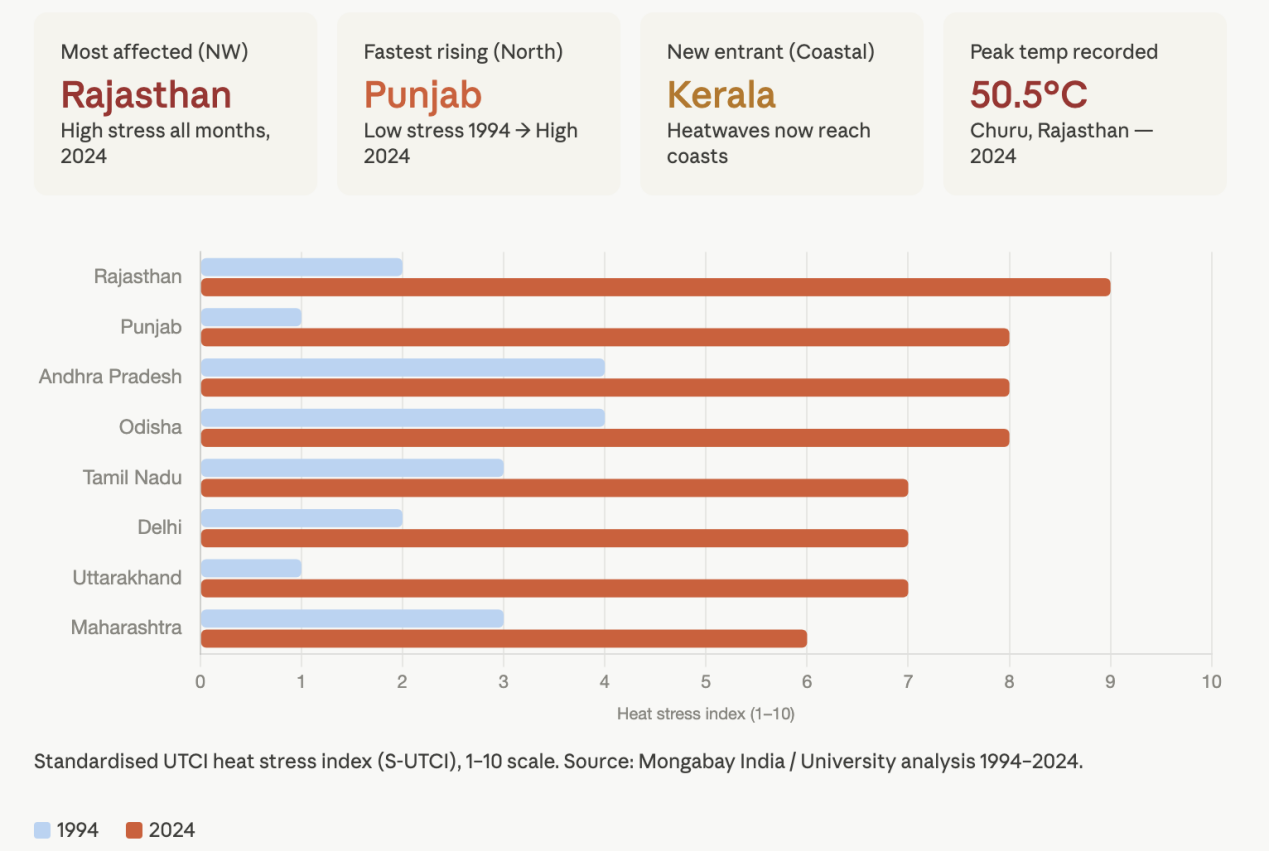
Heat does not spread around evenly; it has favourites. It keeps finding new ones. If you look at the heat stress data from 1994, 2015 and 2024, you can see the change that has taken place. Back in 1994, most states did not have an increase in heat stress, or they were just around average. If you jump to 2015, you can see that the southern states like Andhra Pradesh, Tamil Nadu, and Karnataka were dealing with moderate to high heat stress. This year, it is Rajasthan, Punjab and Uttarakhand in the north that are showing high heat stress almost every month.
What makes 2024 stand out is the geography of the heatwave. The heatwave reached all the way to Kerala, a state on the southwest coast that rarely sees this kind of thing. This is a deal because Kerala used to be protected by its coastal location, high humidity and cool sea breeze. Now that protection is not working well as it used to. When heatwaves start hitting places that rarely see them, it is time to think about which areas are really at risk from heat stress.
The numbers are going up fast. In 2015, heat stress was expected in nine states. By 2019, that number had grown to 23 states, up from 19 in 2018. It keeps going up. Most of India’s years have happened since 2004. Even Punjab, which had little heat stress in 1994, is now just as bad as the deserts of Rajasthan when it comes to heat stress.
The big picture is not good: over 24,000 people died from heatwaves between 1992 and 2015. And that is just up to 2015; things have gotten worse since 2020. The need to understand how exposed India is to heat stress has never been more important. Heat stress is a problem, and India needs to think about how to deal with it. Heat stress is affecting more states, including heat stress in Rajasthan, heat stress in Punjab and heat stress in Uttarakhand.
Rainfall: When Too Much and Too Little Hit at the Same Time
India has always been dancing with the monsoon. The monsoon is not a partner that India can say no to. If there is too much water, whole states get flooded, and if there is too little water, crops dry up. What climate change has done is make this dance very violent. The monsoon is no longer slow and rhythmic; it is now unpredictable. Can change suddenly.
Every year, on average, flooding affects 75 lakh hectares of land in India. 1,600 People lose their lives. The damage to crops, houses and public utilities is around ₹1,805 crores. The National Disaster Management Authority is concerned about these numbers. What is even more worrying is that some years are much worse than others, and this is making the trend look very bad.
In 2024, India saw weather events on 314 out of 365 days. This is a big number. There were 51 days in the whole year when India did not see some kind of extreme weather event like a flood, a heatwave, a cyclone or a cloudburst. Many people and animals lost their lives. A lot of homes and crops were destroyed.
The floods in Kerala in 2018 were a turning point. The monsoon that year was so strong that all 14 districts of Kerala were under alert at the same time. It was the flooding Kerala had seen in almost a century. The monsoon is becoming more and more unpredictable. This is causing a lot of problems.
In 2024, there were three flooding events in India, each of which would normally happen only once in 75, 100 and 200 years. They all happened in the same year. The heavy rainfall in June 2024 was very bad for Assam, causing 109 deaths and affecting people. By September, Gujarat had received more rainfall than usual, and people who had been displaced by floods were still trying to rebuild their homes when another extreme event hit.
The saddest thing is that India sees both flooding and extreme drought in the same year. Sometimes this happens in districts. The rainfed areas in India become very dry, while the Himalayan foothills and coastal plains get flooded. The monsoon is no longer about how rain falls but about how heavy the rain is. There are rainy days, but when it rains, it rains very heavily and can cause a lot of damage. This is very bad for farming, which needs consistent moisture throughout the growing season. The monsoon is becoming more violent. This is causing a lot of problems for India.
Temperature Anomalies: Three Decades of Evidence
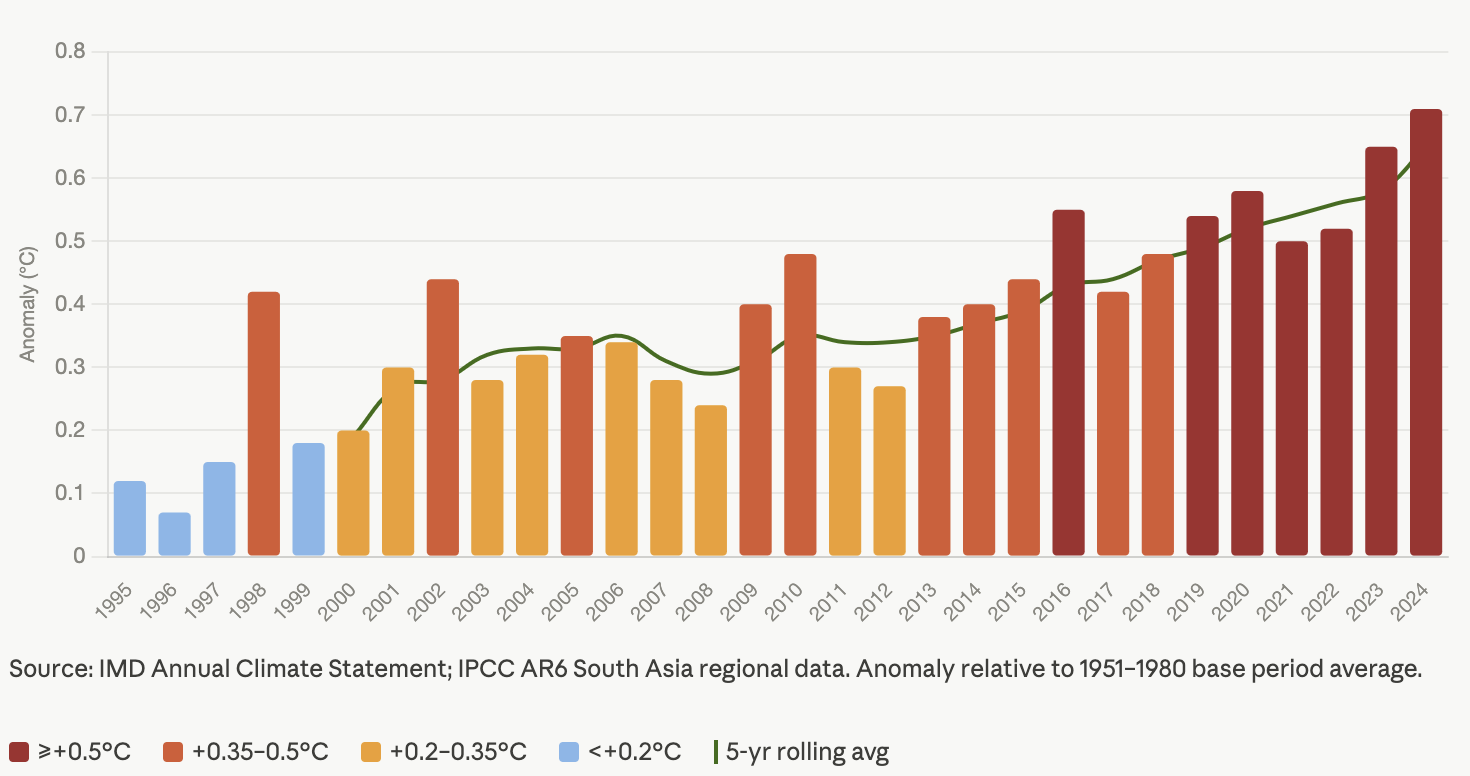
There is something almost relentless about Figure 4. Look at the left side of the chart — the late 1990s, where bars hover near zero. Then watch the colour shift: from blue to amber to orange to deep red as you move rightward through time. The bars do not climb every single year — climate is messy, not linear — but the rolling average (the green line) never dips. It only rises.
The IMD discovered that between 1951 and 2015, the average maximum summer temperature in India’s three most significant meteorological zones increased dramatically. What the chart above — constructed from IMD annual climate statements and IPCC AR6 South Asia regional data — shows is that the post-2015 acceleration has been especially sharp. The years 2023 and 2024 sit at anomalies of +0.65°C and +0.71°C, respectively, the two highest on record.
Night temperatures deserve particular attention. They are the hidden half of the warming story. IMD data showed that Delhi recorded its warmest-ever night at a minimum temperature of 35.2°C during the 2024 heatwave. When nights fail to cool down, the human body has no window of recovery. Heat stress compounds — not just on people, but on livestock, crops, and infrastructure. Roads buckle, transformer loads spike, and the urban poor, who cannot afford air conditioning, face the kind of physiological strain that kills.
The Fields Feel It First
The heatwave numbers show what climate change is doing to the sky. The agricultural data shows what it is doing to the ground for the 650 million rural Indians whose food, income and identity are tied to what grows in the soil.
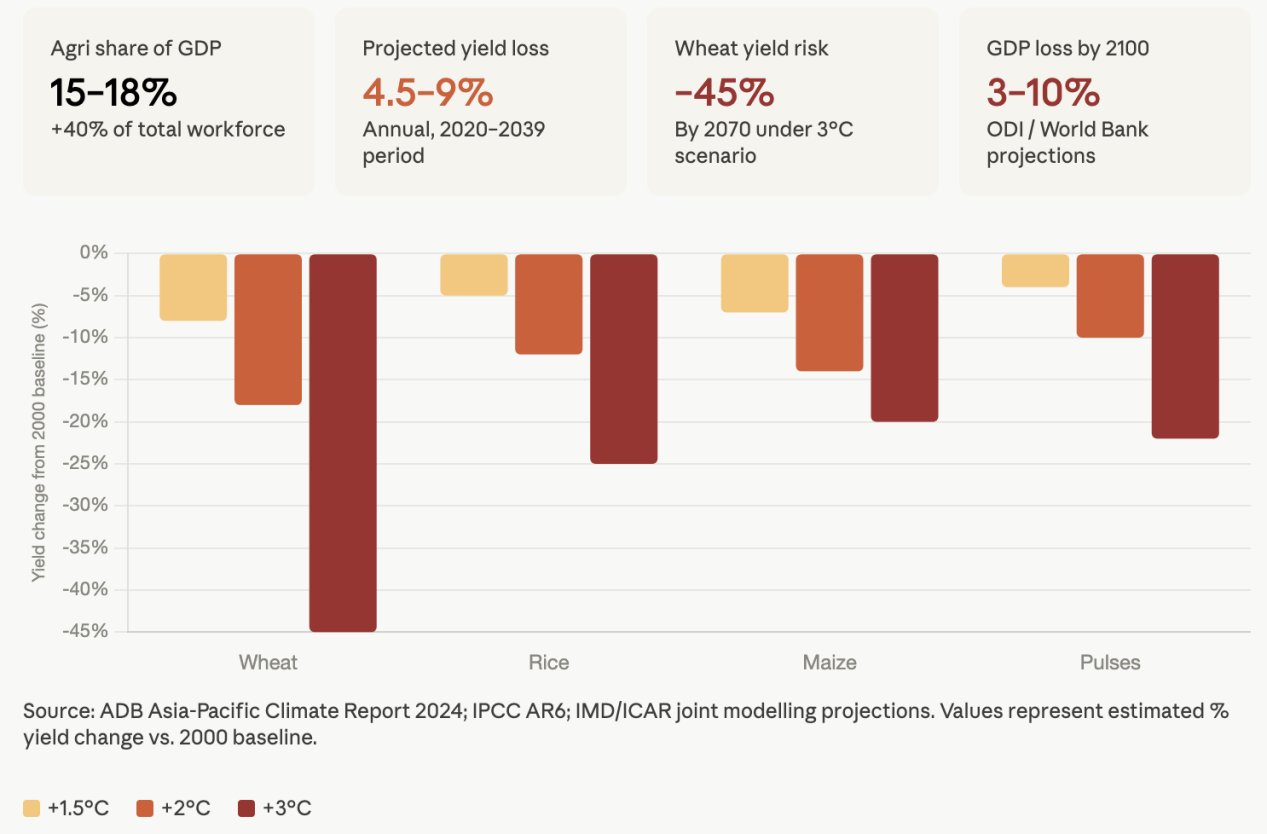
Agriculture is a part of India’s economy, making up 15% of India’s GDP and employing around 40% of its population. These numbers are not about money; they are about how India feeds itself and keeps people busy. When agriculture has problems, everything else does too.
The problem is that Indian agriculture is very vulnerable. The Indian monsoon is what most of the country’s farmland relies on, with over 65% of the land depending on the rain and not having a water supply. So when the monsoon is late, or there is a spell or too much rain at the wrong time, it can destroy a whole season’s worth of crops for a small farmer who does not have any savings and has a loan to pay back.
Agriculture is going to be impacted by climate change, with wheat and maize yields dropping by as much as 45% and 20% by 2070 if the Earth gets very hot. Labour productivity will also decrease by 30%. The chart in Figure 5 shows what will happen at different temperatures. Even if the earth only gets 1.5°C, which is what we are hoping for, wheat yields will still drop by 8% and pulses by 4%.
If the Earth gets 3°C hotter, the results will be disastrous.
Climate change could reduce yields in India by 4.5–9% every year from 2020 to 2039. We are already in that time period. The past three years have had problems like heat, uneven rains and flooding after harvest, which shows that these predictions are not just worst-case scenarios but what is actually happening now.
Wheat, which is a crop in India, is very sensitive to heat when it is growing. If it gets too hot above 35°C, the yield can be reduced by up to 20% if the farmers do not do something to adapt. In the summer of 2022, a heatwave occurred in March in Punjab and Haryana when the wheat was growing. It cut the yields by about 10–15% in the main growing areas.
GDP Shocks and the Migration Cascade
The economics of climate change are not abstract projections for future governments. They are already showing up in quarterly data, in rural wage surveys, and in the swelling populations of urban fringe settlements that were not there a decade ago.
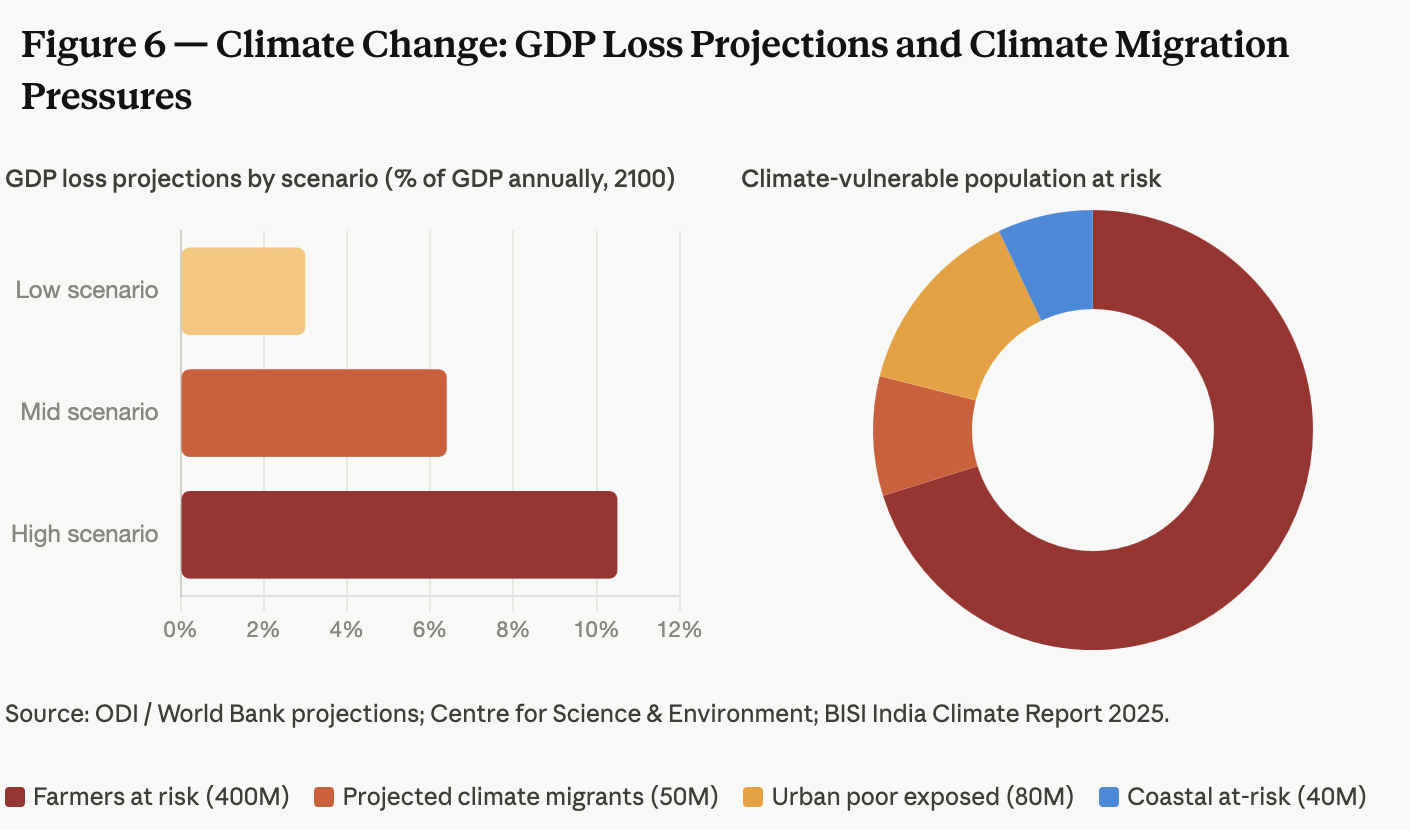
A report by the Overseas Development Institute found that India may lose anywhere around 3–10% of its GDP annually by 2100, and its poverty rate may rise by 3.5% in 2040 due to climate change. The mid-scenario figure — 6.4% of GDP — is equivalent to erasing nearly the entire annual growth dividend that India has worked to generate. Projections suggest potential GDP losses ranging from 6.4% to over 10% by 2100, with an estimated 50 million people at risk of falling back into poverty due to climate-related challenges.
The social cost of carbon sits particularly heavily on India. India has the world’s highest social cost of carbon, amounting to US$86 per tonne of CO₂— meaning each additional tonne of emissions entering the atmosphere costs the Indian economy more than almost any other country. The US pays $50 per tonne in equivalent social cost; China, $26. India pays the most for a problem it has contributed to least in per-capita terms.
Then there is migration — the part of this story that plays out not in IMD bulletins or economic models, but in human faces at bus terminals and migrant worker hostels. Persistent agricultural distress is driving rural-to-urban migration, as families search for stable income in cities. This exodus puts pressure on urban infrastructure, often resulting in unplanned settlements and new forms of social vulnerability.
The National Sample Survey Office reports that agricultural households in regions severely affected by climate change show higher rates of migration. In Vidarbha, where cotton farmers have faced drought-flood cycles for over a decade, the outmigration to Nagpur, Pune, and Mumbai is now structural — not seasonal. Families don’t return. Villages empty slowly and permanently.
In the Janjigir-Champa district of Chhattisgarh, erratic rainfall patterns and delayed monsoons have affected food security and livelihoods, with migration emerging as the most common coping strategy. People are not leaving because cities are attractive. They are leaving because staying has become untenable.
The labour productivity dimension compounds the GDP story further. As temperatures rise above 35°C, outdoor work efficiency drops sharply. Construction workers, field labourers, street vendors, delivery drivers — India’s vast informal economy is disproportionately heat-exposed. A 2°C warming scenario suppresses outdoor labour productivity by an estimated 15–20% across peak summer months, affecting sectors that collectively employ hundreds of millions.
A Summary View: Connecting the Dots
The four main parts of this analysis. Heatwaves, rainfall variability, temperature anomalies and economic impacts. Are all connected. They are the issues seen from different angles.
The temperature record has changed over the past 30 years. This change makes heatwaves happen more often, last longer, and become more severe. The warmer seas and changes in the atmosphere make rainfall during monsoons extreme and also cause longer dry spells. All these changes affect agriculture in various ways. Like late frosts, early heat, uneven rain for planting and floods that destroy crops. This has an impact on the economy and society, and it forces people to move to cities that are already very crowded.
As climate change makes heatwaves more common, longer and worse, scientists are warning that it could put over a billion people in danger. This is not an exaggeration. It is what the data says.
The numbers show that India is not just going to face a climate problem in the future. It is already dealing with a crisis that gets worse every year. The 554 days of heatwaves in 2024, the 314 days of weather, the 2 million hectares of crops that were destroyed and the 50 million people who will become poor again. These are not warnings. They have already happened.
The question now is not whether climate change will affect India. The question is whether the government’s response. Like plans to deal with heatwaves, building infrastructure to prevent floods, creating seeds that can withstand climate change, helping farmers who have lost their homes and planning cities that can handle people moving there because of climate change. Will happen fast to keep up with the crisis. The data says it has not happened yet. The data also says there is still time to change this. Though the time we have is getting shorter, like the cool nights in Delhi that are becoming less common.
| Data sources: India Meteorological Department (IMD) Annual Climate Statements; National Disaster Management Authority (NDMA) flood damage database; IPCC AR6 South Asia regional chapter; Asian Development Bank Asia-Pacific Climate Report 2024; Overseas Development Institute GDP projections; Centre for Science & Environment India Weather & Climate Report 2024; Mongabay India / UTCI heat stress analysis 1994–2024; World Economic Forum India climate resilience briefs. |
Divyanka Tandon holds an M.Tech in Data Analytics from BITS Pilani. With a strong foundation in technology and data interpretation, her work focuses on geopolitical risk analysis and writing articles that make sense of global and national data, trends, and their underlying causes. Views expressed are the author’s own.